Fig. 4.
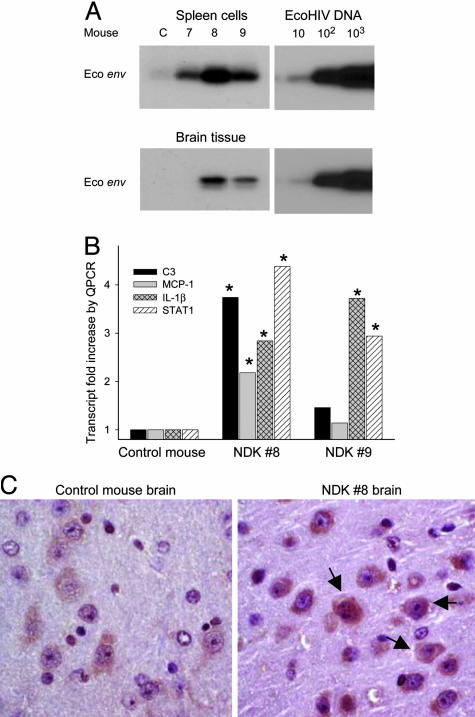
EcoNDK infects conventional mice and alters cellular gene expression in the brain. (A) PCR amplification of EcoNDK viral DNA in spleen and brain 3 wk after inoculation; standard curves of amplification of plasmid DNA are at the right. (B) Quantitative real-time RT-PCR was conducted on total cellular RNA from brain tissue of EcoNDK 8 and 9, comparing levels of transcripts with levels found in the control brain. *, Differences compared with control at P < 0.05 by t test. (C) Immunocytochemical staining for STAT-1 in mouse cortical brain sections; arrows indicate examples of more intense staining for STAT-1 in NDK 8 (Right) compared with the control brain (Left). (×360.)

