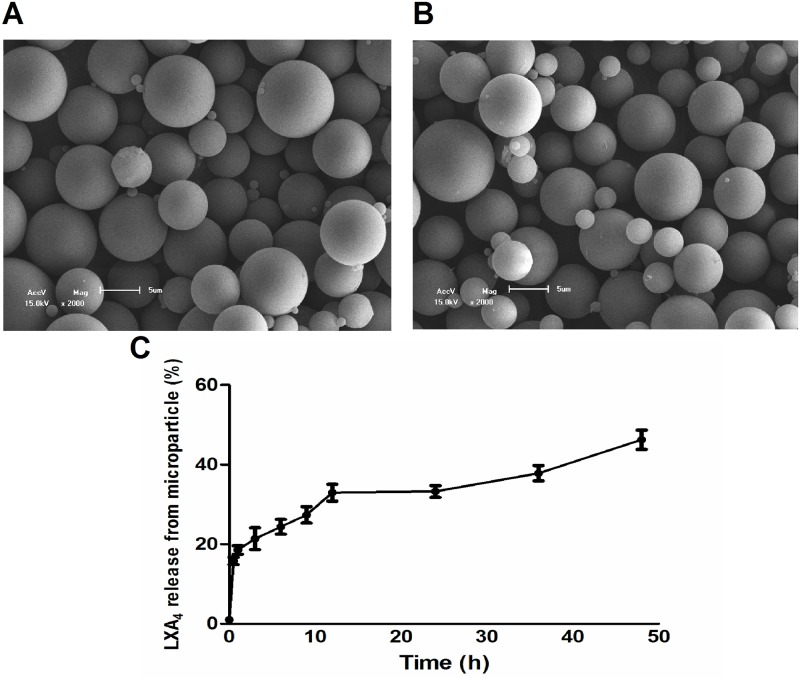
Fig 1. Scanning electron microscopy (SEM) of microparticles and in vitro release of LXA4 from MS.
Representative images (2,000×) of (A) Unloaded and (B) LXA4-MS morphologies. (C) In vitro cumulative release of LXA4 from LXA4-MS. LXA4 concentration was determined by mass spectrometry over 48 h. Data are representative of two batches.

