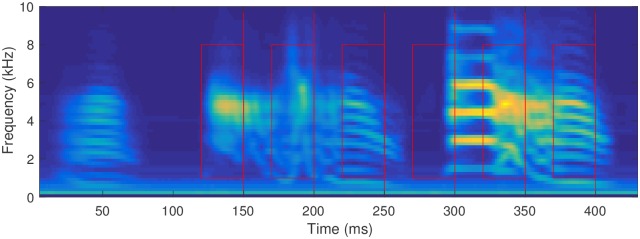
Fig 1. The spectrogram of the song of the bird “lny64”, used as an example throughout this paper.
This image was made by superposing the spectra of our 2818 aligned songs. Our example detection points, , are shown as red lines, with example recognition regions of 30 ms × 1–8 kHz marked as rectangles.

