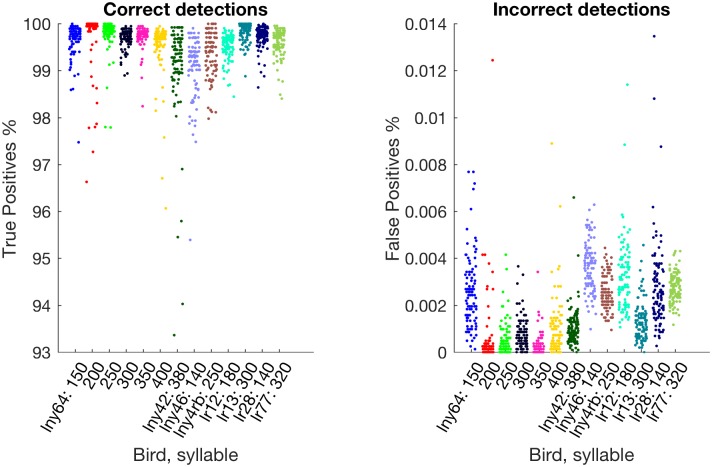
Fig 3. Accuracy variability over 100 different training runs for each of the test detection points.
Each dot shows the test-set accuracy for an independently trained detector. Because the horizontal positions have been randomised slightly so as not to occlude same-valued measurements, test syllable is also indicated by colour. The means are given in Table 2.

