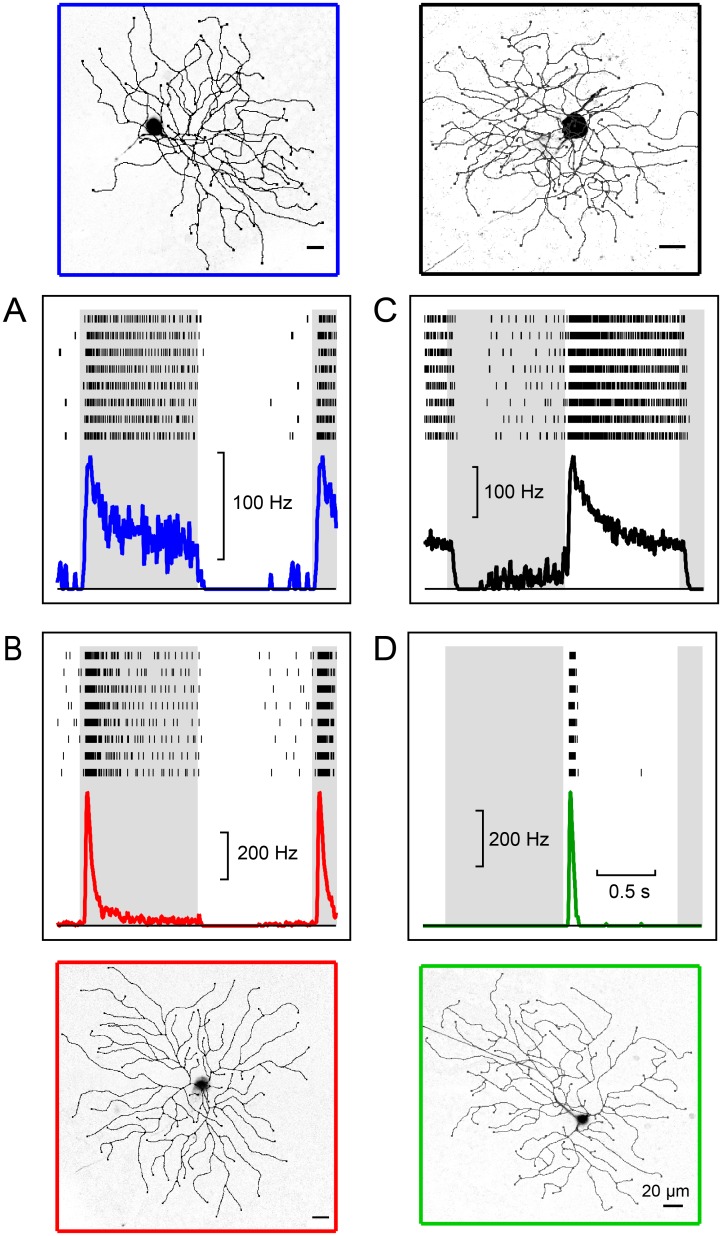
Fig 1. Morphology and light responses of mouse alpha retinal ganglion cells (αRGCs).
A-D, Sample neurons with whole-mount views (outer images) and responses to a flashing spot (inner plots) for the Off-sustained (A), Off-transient (B), On-sustained (C), and On-transient (D) types. Raster graph illustrates action potentials on repeated trials of a spot flashing on (white background) and off (gray) every 2 s. Continuous curve is average firing rate over 10 or more trials.

