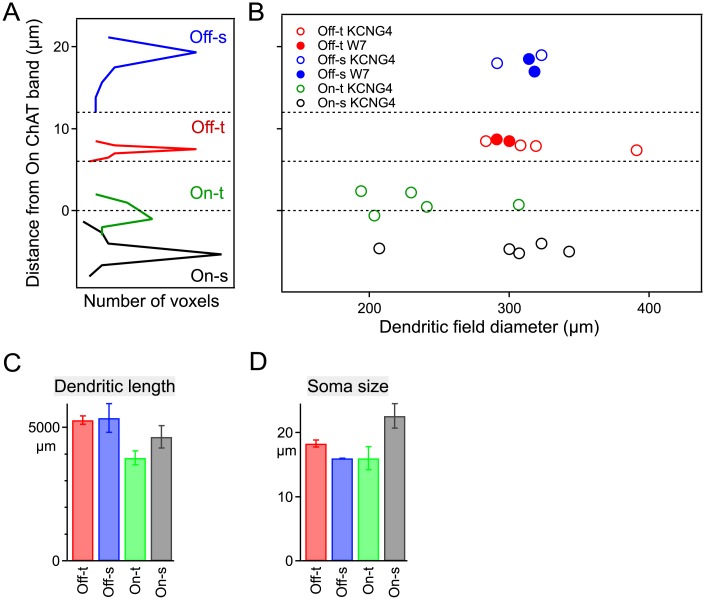
Fig 4. The four αRGC types stratify their dendrites in distinct layers of the IPL.
A: Stratification of the 4 neurons from Fig 1. Each histogram indicates the depth distribution of fluorescent voxels in the dendrites of one cell relative to the two ChAT bands in the inner plexiform layer (at 0 and 12 μm depth). B: Stratification and dendritic diameter of many αRGCs, visualized either using the KCNG4-Cre line (all types) or the W7 transgenic line (Off types). For each cell, the stratification level is the mean of the histogram computed as in panel a. C-D: Total dendritic length (C) and soma diameter (D) for the four αRGC types; mean ± SEM (n = 7, 4, 6, 5 left to right in each bar graph).

