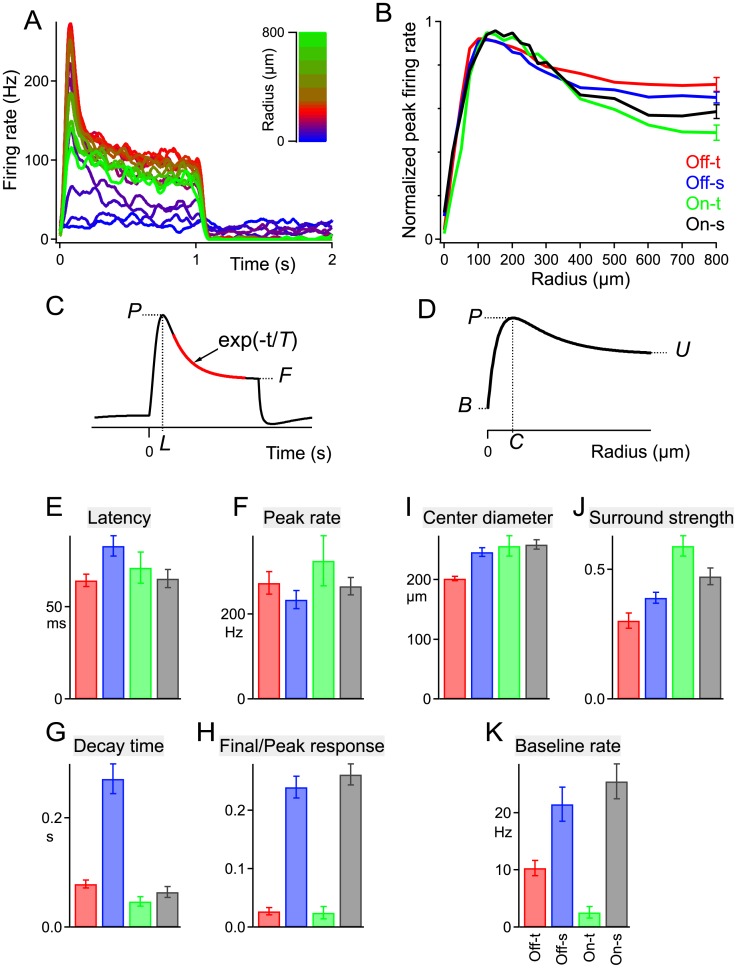
Fig 5. Spatio-temporal responses of the four αRGC types.
A: Responses of a sample On-s cell to flashing spots of increasing radius (see inset color scale). Firing rate averaged over 6 repeats. B: Peak firing rate as a function of spot size from experiments such as in panel a. Curves were normalized to the maximal rate for each cell, then averaged over all cells of the same type. The error bars on the last data point are representative for SEM throughout the curve. C: From the spot stimulus giving the strongest response in panel a, one derives the latency to peak firing (L), the peak firing rate (P), the final firing rate (F) and the exponential decay time (T), as indicated in this schematic. D: From the measurements of panel B, one defines the baseline firing rate (B), the spot size producing the maximal rate (C) and the response to large uniform stimuli (U), as indicated in this schematic. E-K: Response parameters of all 4 cell types. Mean ± SEM over all cells of the same type (n = 28, 32, 8, 22 left to right in all bar graphs). Based on the measures from panels c and d: Latency = L; Peak rate = P; Center diameter = C; Surround strength = 1-(U-B)/(P-B); Decay time = T; Final/Peak response = (F-B)/(P-B); Baseline rate = B.

