. 2017 Jul 28;12(7):e0180091. doi: 10.1371/journal.pone.0180091

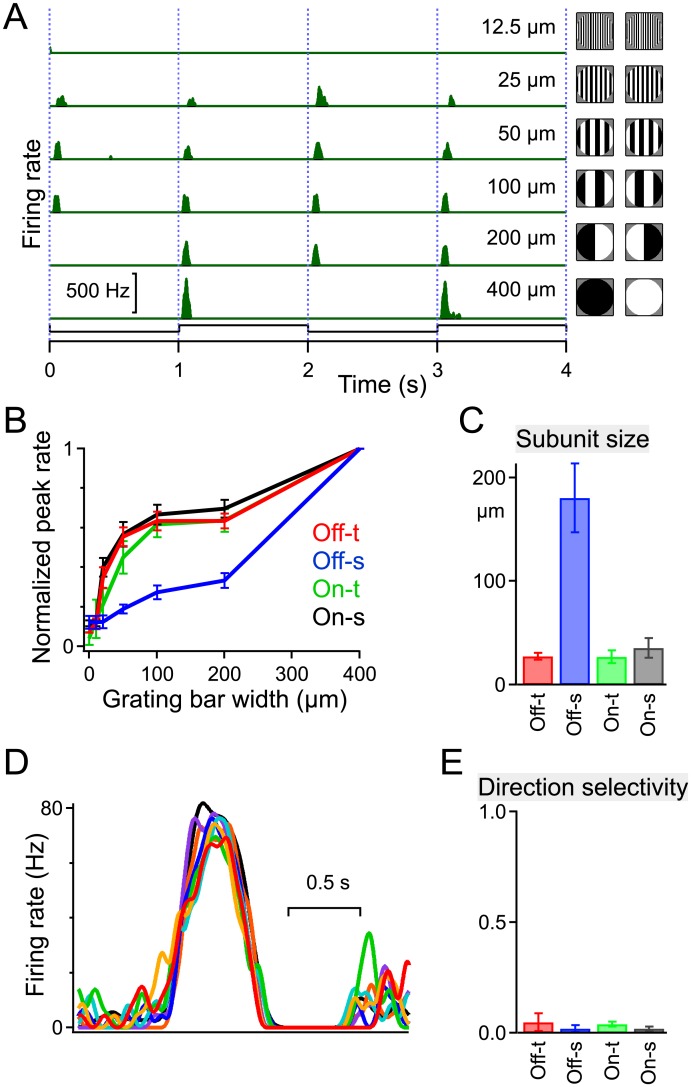
Fig 6. Nonlinear subunits and directional processing.

Fig 6

A-C: Tests for nonlinear summation within the receptive field. The stimulus was a 400 μm-diameter spot centered on the receptive field, filled with a stripe grating that contrast-reversed every 1 s. For stripes of width 200 μm or less, a stripe boundary passed through the spot center. A: A sample RGC fires a burst of spikes on every grating transition unless the stripe width drops below a threshold, here 25 μm. B: Peak firing rate as a function of stripe width, normalized to the response to the uniform spot (400 μm); mean ± SEM across cells of each type. C: Threshold stripe width, an estimate of subunit size; mean ± SEM across cells of each type (n = 22, 23, 8, 20 left to right in panels B and C). All alpha types except Off-s show nonlinear summation over subunits ~30 μm in size. D-E: Tests of direction selectivity. D: Firing of a sample RGC in response to a 250 μm diameter spot of the preferred polarity moving through the receptive field center at 700 μm/s in 8 directions spaced at 45° (different colors). E: Direction selectivity index computed from such responses as
D=|kPkeiφk/kPk|,
where φk is the direction of motion of the k-th stimulus, and Pk is the peak firing rate evoked by that stimulus. Mean ± SEM across cells of each type (n = 3, 3, 7, 3 left to right).