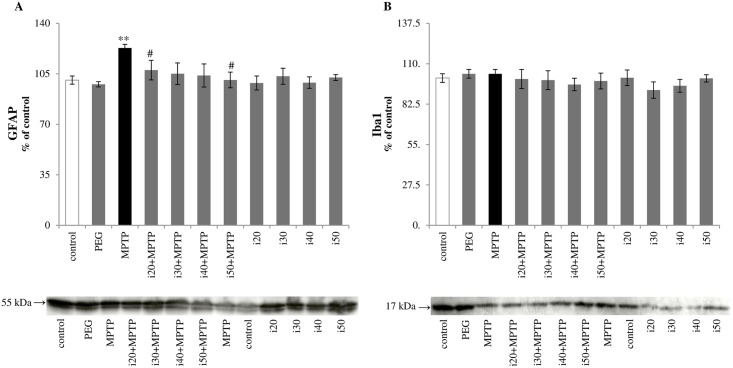
Fig 2. Protein expression of (A) GFAP and (B) Iba1 in the striatum, evaluated by immunoblot analysis.
Abbreviations of groups of animals: control–saline-treated; PEG–vehicle-treated; MPTP–MPTP-intoxicated; i(20, 30, 40, or 50)+MPTP–IBD [20, 30, 40, or 50 mg/kg] and MPTP-treated; i(20, 30, 40 or 50)–IBD [20, 30, 40, or 50 mg/kg] treated. The values are expressed as mean ± SEM, for five mice per group (* represents a significant difference relative to control group, **p<0.01; # represents a significant difference compared with the MPTP group, #p<0.05; Mann Whitney U test).

