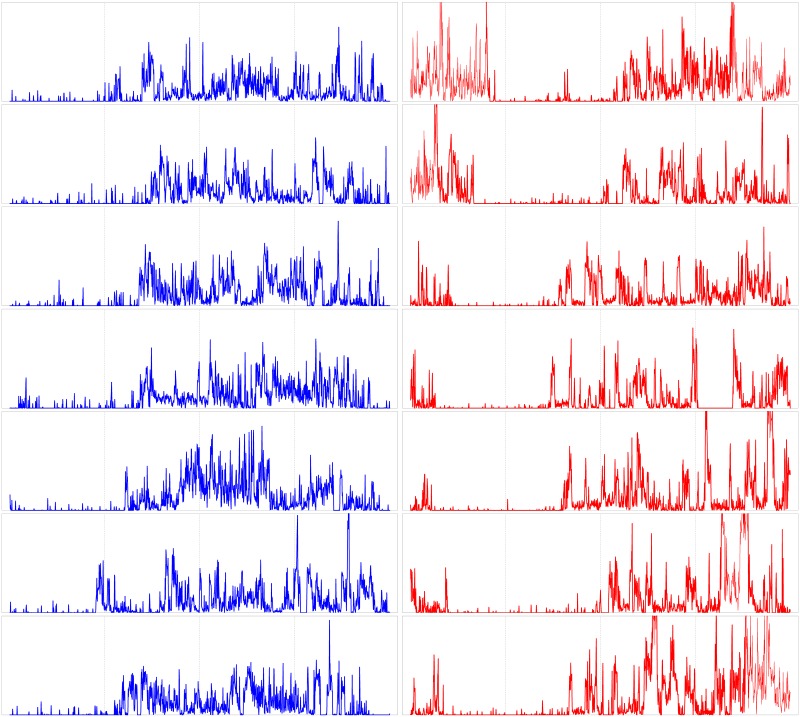
Fig 1. 1-week continuous actigraphy time series.
Shown for a specific control subject (female, 24yo, left-hand panels) and a subject with acute insomnia (male, 22yo, right-hand panels). Shown for 7 successive days (24h per panel), from midnight till midnight, with vertical gridlines at 6h intervals at 00:00, 06:00, 12:00, 18:00 and 24:00 hours. Vertical scale is identical for both subjects, from 0 to 3000 movement counts per minute.

