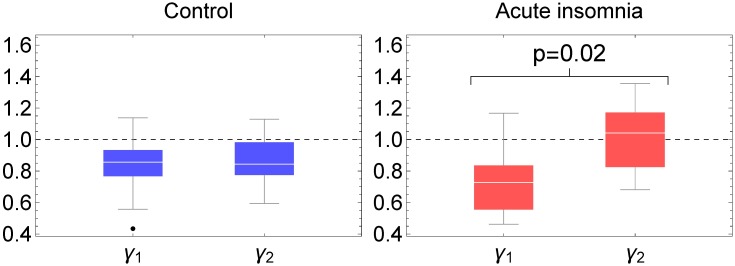
Fig 8. Fractal scaling parameters according to SSA analysis.
Box-whisker plots of the scaling exponent of the power law λk ∝ 1/kγ at larger scales (exponent γ1) and at smaller scales (exponent γ2) before and after log10 k = 1.5, shown for the control subjects which follow a single power law (blue) and subjects with acute insomnia which exhibit a crossover (red).

