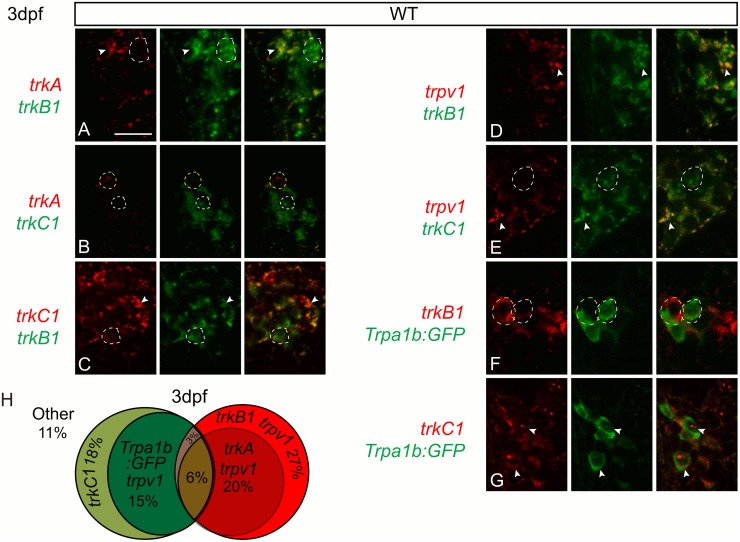
Fig 1. The zebrafish trigeminal ganglion contains many somatosensory subpopulations defined by the neurotrophin receptors and trpv1 and trpa1b nociceptive ion channels.
A-E, Optical sections of double fluorescent in situ hybridization for trkA (red) and trkB1 (green) (A), trkA (red) and trkB1 (green) (B), trkA1 (red) and trkC1 (green) (C), trkC (red) and trkB1 (green) (D), trpv1 (red) and trkB1 (green) (E) and trpv1 (red) and trkC1 (green in wild-type fish at 3dpf. F-G, Optical sections of antibody staining of GFP (green) in conjunction with fluorescent in situ hybridization for trkB1 (F) and trkC1 (G) in trpa1b:GFP fish at 3dpf. H, Representations of 3dpf wild-type somatosensory subpopulations as a percent of the whole TG. Dashed white line outline green cells; Dashed yellow lines outline red cells; Arrowhead indicates double positive cells. Scale bar: 20μm. Embryos per condition (n = 3–4).

