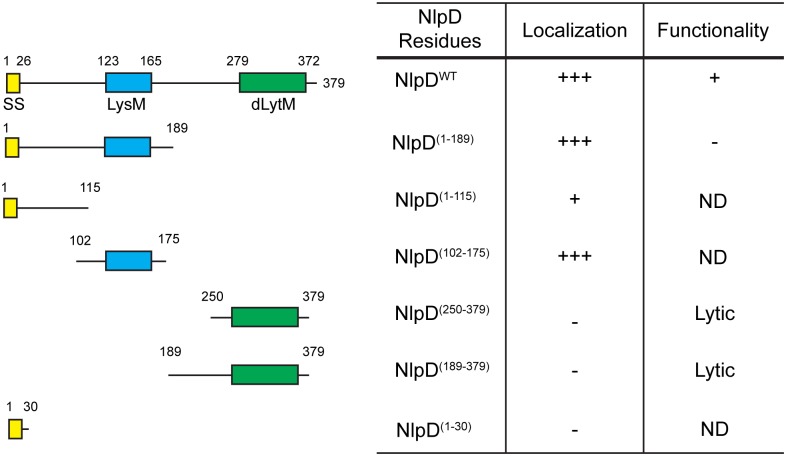
Fig 1. Structure-function analysis of NlpD.
The domain organization of NlpD is illustrated. Indicated are the signal sequence (SS; yellow), lysin motif (LysM; blue), and the degenerate LytM domain (dLytM; green). Also shown are the NlpD truncations that were expressed under the control of the IPTG-inducible lactose promoter either as an untagged protein or as a C-terminal mCherry fusion. Truncations lacking SSNlpD are expressed as soluble periplasmic proteins fused to the DsbA signal peptide. Columns indicate (i) the NlpD residues present in each truncation, (ii) whether the fusion to mCherry accumulated at division sites strongly (+++), poorly (+), or appeared evenly distributed along the periphery of the cell (-), and (iii) whether the untagged truncation could (+) or could not (-) compensate for the loss of endogenous NlpD for proper cell separation. ND, not determined.

