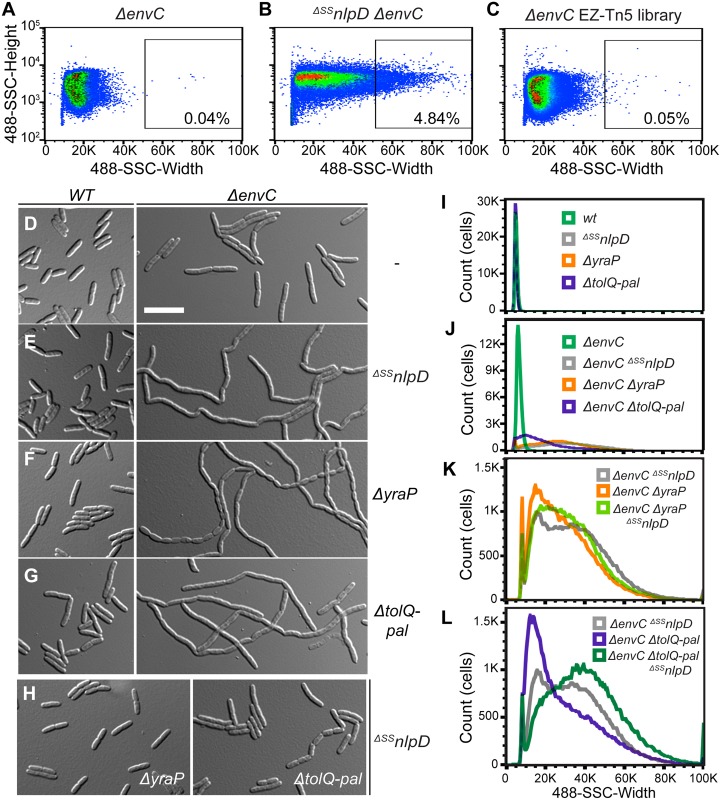
Fig 5. Flow cytometry-based enrichment and screen to identify potential NlpD regulators.
(A-C) Dot plots of (A) a control non-chaining strain, TB140 (ΔenvC), (B) a control chaining strain, MT50 (ΔSSnlpD ΔenvC), and (C) the transposon (EZ-Tn5 <Kan-2>) mutagenized TB140 library, with side scatter pulse height (SSC-H; y-axis) versus side scatter pulse width (SSC-W; x-axis). The gate used for sorting is shown on the plot, with the number of events present in that gate indicated as a percentage of the total population. (D-J) Overnight cultures of (D) TB28 (wt), TB140 (ΔenvC), (E) MT47 (ΔSSnlpD), MT50 (ΔenvC ΔSSnlpD), (F) MT140 (ΔyraP), MT135 (ΔenvC ΔyraP), (G) MT51 (ΔtolQ-pal), MT55 (ΔenvC ΔtolQ-pal), or (H) MT141 (ΔSSnlpD ΔyraP), MT53 (ΔSSnlpD ΔtolQ-pal) were diluted in LB medium. Cells were grown at 30°C to an OD600 of 0.3–0.5 before they were visualized on 2% agarose pads with DIC optics (D-H) or analyzed by flow cytometry (I-J). Bar = 10μm. (K-L) Overnight cultures of MT50 (ΔenvC ΔSSnlpD) and (K) MT135 (ΔenvC ΔyraP) and MT179 (ΔenvC ΔyraP ΔSSnlpD) or (L) MT55 (ΔenvC ΔtolQ-pal) and MT96 (ΔenvC ΔtolQ-pal ΔSSnlpD) were diluted in LB medium. Cells were grown at 30°C to an OD600 of 0.15–0.25 before analysis by flow cytometry.

