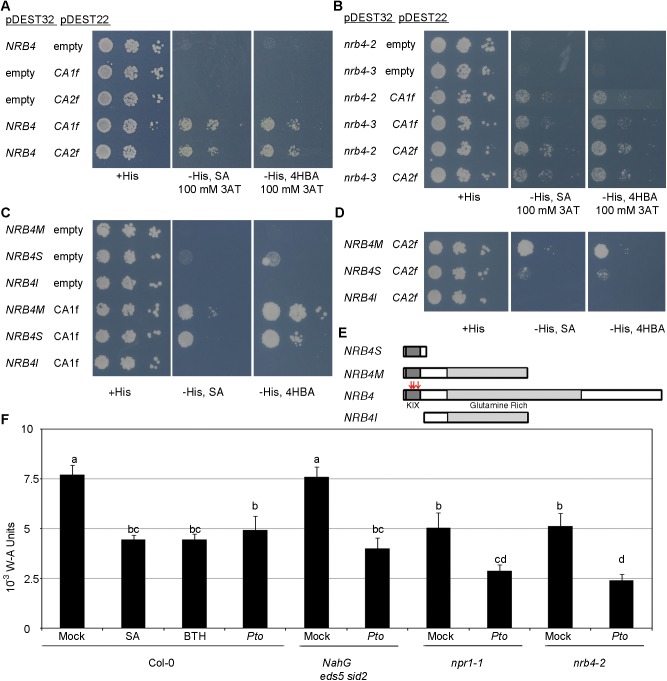
Fig 1. NRB4 interacts with βCA1f and βCA2f.
(A) Yeast cells transformed with the indicated plasmids and inserts were grown on three different sets of plates. The first set contained minimal medium supplemented with histidine (+His), the second contained the same minimal medium with no histidine (-His), 100 μM salicylic acid (SA), and 100 mM 3-Amino-1,2,4-triazole (3AT), and the third lacked histidine (-His) and contained 100 μM 4-hydroxybenzoic acid (4HBA) and 100 mM 3AT. The first three rows indicate that NRB4, βCA1f, or βCA2f alone do not allow the yeast to grow in medium lacking histidine. The growth of yeast in the remaining two rows on -His plates indicates that NRB4 interacts with βCA1f and βCA2f. Note that the presence of SA or 4HBA does not affect the interaction. (B) βCA1f and βCA2f interact with the point mutations of NRB4 in planta. The interactions between βCA1 and βCA2 with nrb4-2 and nrb4-3 were tested as mentioned in “A”. (C) βCA1f interacts with the KIX domain of NRB4. The interaction between βCA1f and three different constructs of NRB4 was tested as mentioned in “A”, except that the -His plates did not contain 3AT. (D) βCA2f interacts with the KIX domain of NRB4. The interaction between βCA2f and three different constructs of NRB4 was tested as mentioned in “C”, with the controls shown in “C”. (E) Diagram of the NRB4 constructs used in the previous panels. The names of the domains are under the wild type NRB4. The red arrows indicate the point mutations found [20]. (F) CA activity in different genotypes and under different treatments. Two weeks old Col-0 plants were treated with mock solution, 1 mM SA, or 350 μM benzothiadiazole (BTH), and the samples were frozen one day later. Similarly, Col-0, NahG eds5 sid2, npr1-1, and nrb4-2 plants were inoculated with Pseudomonas syringae pv. tomato isolate DC3000 (Pto) at an OD600 of 0.1, and the samples were frozen one day later. The samples (three repeats of approximately 100 mg each) were ground and CA activity measured based on the change in color of bromothymol blue following the change in pH. In all figures where numerical information is presented, the data represent the average values, with error bars showing standard deviation. The letters above the bars indicate different homogeneous groups with statistically significant differences (Fisher’s LSD Test, P < 0.05). All experiments were repeated at least three times with similar results.

