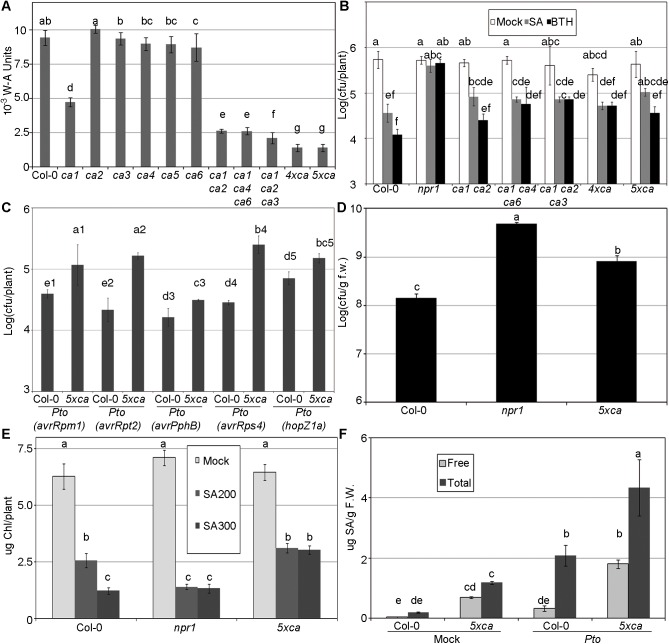
Fig 6. SA perception phenotypes of the βCA T-DNAs.
(A) CA activity in plants with a single T-DNA insertion in the βCA genes and combinations of these mutants. In the case of βca5, the homozygous plant was sterile (S11 Fig), and the progeny of a heterozygous plant were used. The activity was measured as in Fig 1F; 4xβca represents βca1 βca2 βca4 βca6, while 5xβca represents βca1 βca2 βca3 βca4 βca6. (B) Combinations of T-DNA insertions reduce SA and BTH perception. 14-day-old plants were treated with 500 μM SA, 350 μM BTH, or mock solution. One day later, the plants were inoculated with Pseudomonas syringae pv. tomato isolate DC3000 (Pto) at an OD600 of 0.1. Three days after inoculation, Pto growth was evaluated as the logarithm of colony forming units (cfu) per plant. The remaining βca genotypes are showed in S12 Fig. (C) Decrease in effector-triggered immunity. The indicated genotypes were inoculated as in “B” with different Pto strains containing the indicated effectors. The numbers after the letters indicate that these are independent experiments and only data with the same number can be compared. The complete set of experiments is showed in S12 Fig. (D) eds-like phenotype. Seven-week-old plants were hand infiltrated with Pto at an OD600 of 10−4. Three days after inoculation, Pto growth was evaluated as the logarithm of cfus per g of fresh weight. (E) Decrease in the toxic effect of SA. The βca mutants and the controls were grown on MS plates supplied with 0, 200, and 300 μM SA (photographs in S12 Fig), and the chlorophyll contents of the plants were measured as an indication of the response to SA (30 plants in three groups of 10). (F) The βca mutants accumulate more SA than wild type. The SA levels (both free and total) were measured three days after mock or Pto inoculation as in “B”, with samples of 15 plants in three groups of five.

