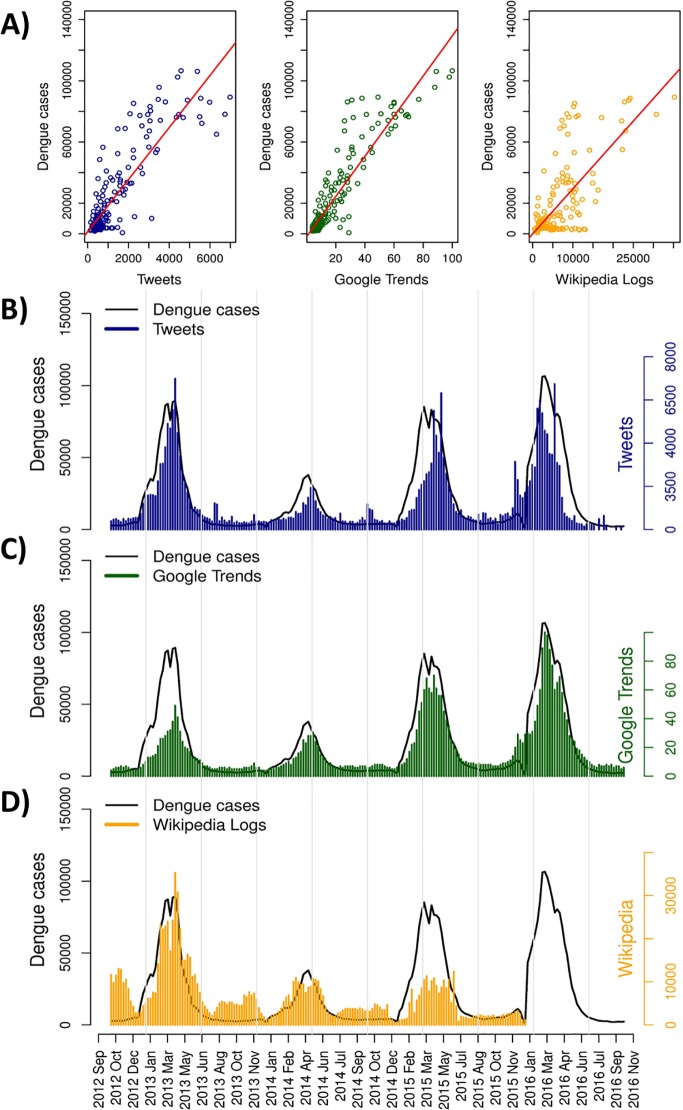
Fig 1. Country wide time series for web-based data and Dengue cases.
Scatterplots and linear regression lines for all web-data analyzed: Tweets (r = 0.87, p<0.001), Google Trends (r = 0.92, p<0.001), and Wikipedia (r = 0.71, p<0.01) (A). Dengue Cases times series and association with Dengue web-data: Twitter data (B), Google Trends interest (C), and Wikipedia access logs (D). Each point on graph A represent data aggregate per week from September, 2012 through October, 2016.

