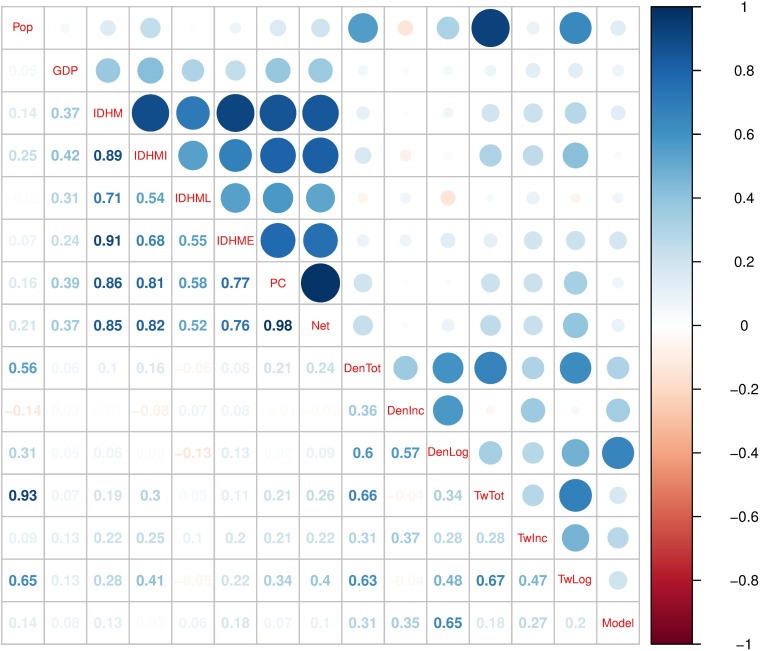
Fig 7. Correlation matrix.
Correlation between different possible explanatory factors and the goodness-of-fit (explained deviance) of the final model. The variables are: population (Pop), gross internal product per capita (GDP), mean human development index (IDHM), human development index for income (IDHMI), human development index for longevity (IDHML), human development index for education (IDHME), coverage of houses with personal computer (PC), coverage of houses with internet access (Net), total Dengue cases (DenTot), total Dengue incidence in cases per 100,000 inhabitants (DenInc), total Dengue cases in logarithmic scale (DenLog), total tweets (TwTot), total tweets incidence in activity per 100,000 inhabitants (TwInc), total tweets in logarithmic scale (TwLog), and deviance explained by the model (Model). Total tweets and Dengue cases were calculated as the sum of occurrences from September, 2012 to October, 2016.

