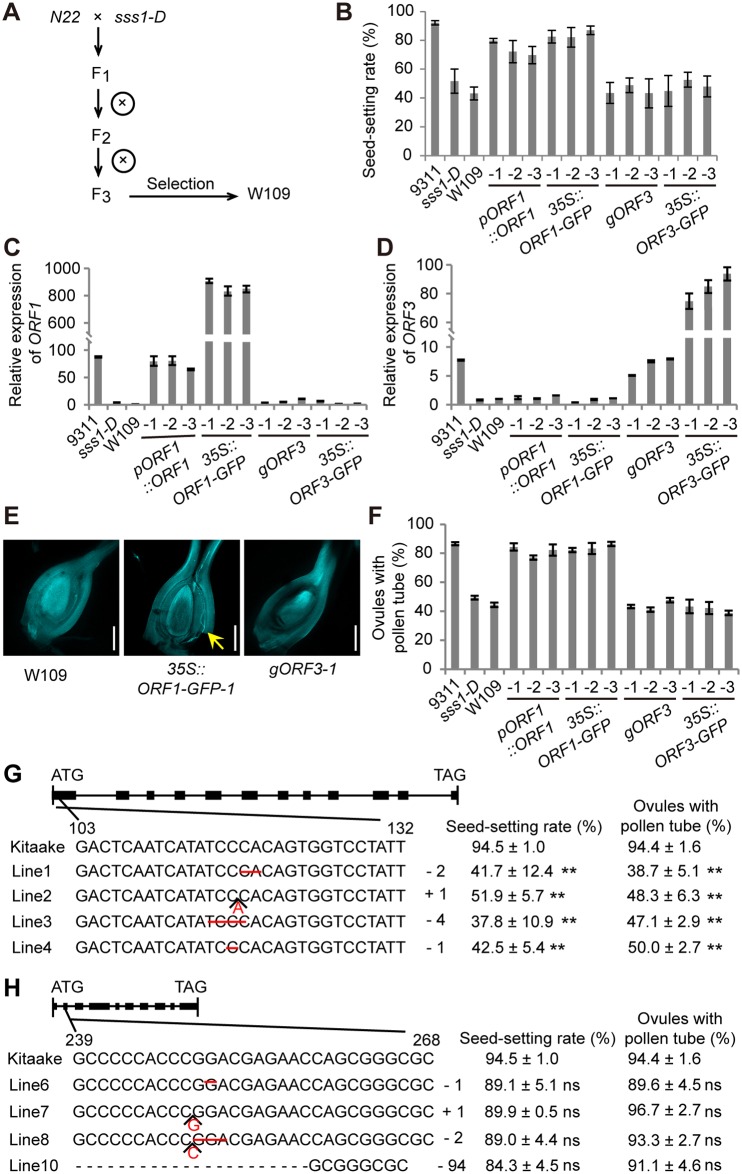
Fig 3. Functional complementation and gene knockout analyses.
(A) Genetic scheme of W109 selection. (B-D) The seed-setting rate (B) and qRT-PCR analysis of ORF1 (primer pair 6F/6R shown in Fig 2D) (C) and ORF3 transcript levels (D) in W109 and the transgenic plants. Three independent transgenic lines individually transformed with pORF1::ORF1, 35S::ORF1-GFP, gORF3, and 35S::ORF3-GFP are shown. (E) Observation of pollen tube growth in W109, 35S::ORF1-GFP-1 transgenic plant, and gORF3-1 transgenic plant. Arrow indicates the pollen tube tip. Scale bars, 300 μm. (F) Frequency of the pistils with at least one pollen tube reaching the ovaries at 120 MAP. (G and H) Sketch map of the mutations of ORF1 (G) and ORF3 (H) in knockout lines. The mutation site, the corresponding seed-setting rate, and the percentage of ovules with pollen tube of each line are shown. Minus (-) and plus (+) signs indicate the number of nucleotides deleted and inserted, respectively. Data are means ± SD (n > 5 in B; n = 3 in G and H); data in F are means ± SD from 3 replicates with > 30 pistils observed per replicate. ns, no significance; **P<0.01 by the Student’s t test.

