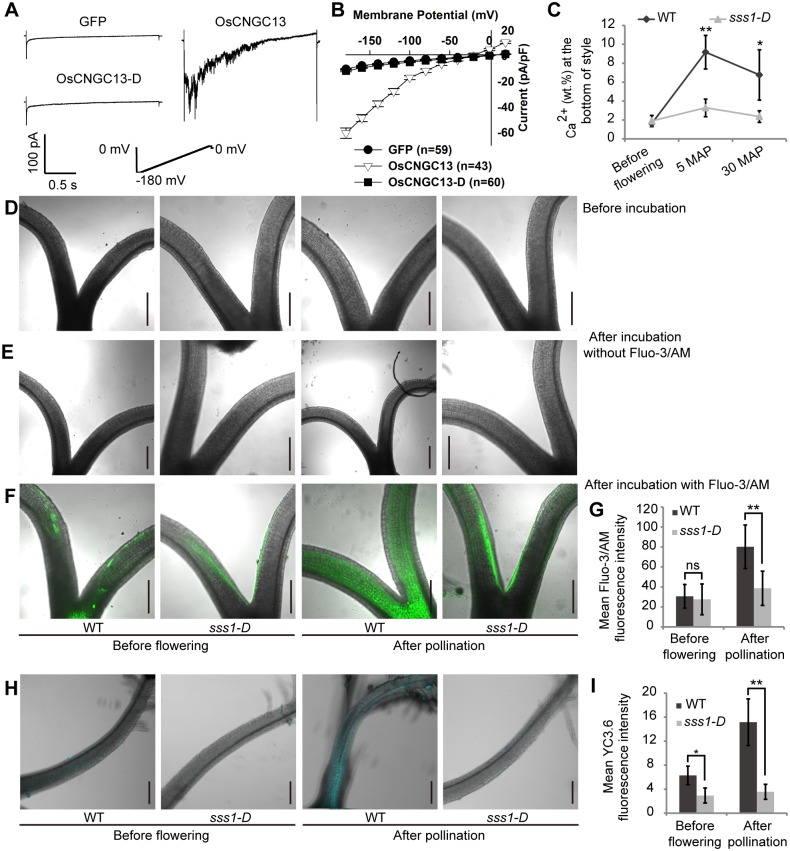
Fig 6. OsCNGC13 exhibits permeability to inward Ca2+ in HEK293 cells and is required for [Ca2+]cyt accumulation in the style.
(A) Patch-clamp whole-cell recordings of inward Ca2+ currents in HEK293 cells transfected with GFP (as a control), OsCNGC13, or OsCNGC13-D. The voltage protocols, as well as time and current scale bars for the recordings are shown. (B) The I-V relationship of the steady-state whole-cell inward Ca2+ currents. The data are derived from the recordings shown in A, and presented as means ± SD. (C) Style Ca2+ content measurement using SEM-EDX. Increased Ca2+ concentrations are detected in WT but not in sss1-D after pollination. (D-G) Fluo-3/AM showing Ca2+ accumulation in the styles. Images of styles before Fluo-3/AM incubation (D), after incubation in the buffer without Fluo-3/AM (E), and after Fluo-3/AM incubation (F) are shown. Note that the samples before incubation and the samples incubated in the buffer without Fluo-3/AM were performed as the negative controls, both of which showed no fluorescence. (G) Quantification of Fluo-3/AM fluorescence intensity. (H and I) Ca2+ accumulation in the styles indicated by the YC3.6 protein fluorescence. (I) Quantification of YC3.6 fluorescence intensity. Data are means ± SD (n = 4 in C; n = 9 in G; n = 6 in I). *P<0.05 and **P<0.01 by the Student’s t test. Scale bars, 100 μm.

