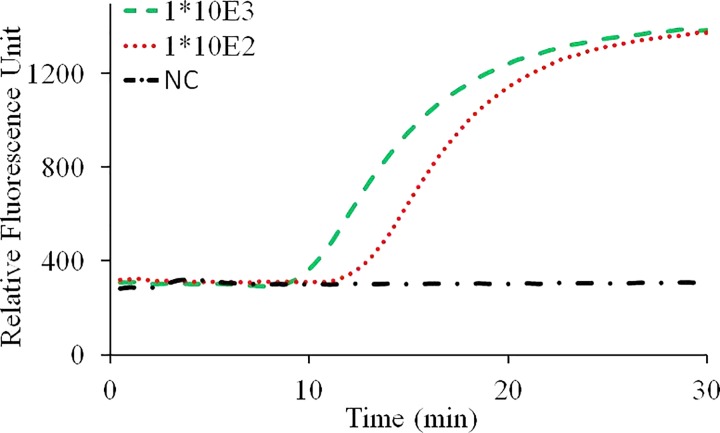
FIG. 8.
Real-time CCPCR with H1N1 influenza virus RNA template. The detected fluorescent intensity is indicated as a function of the amplification time: experiment with diluted samples, the dashed line, dotted line, and dashed and dotted line correspond, respectively, to samples with concentrations of 1000, 100 TCID50/ml and negative control.

