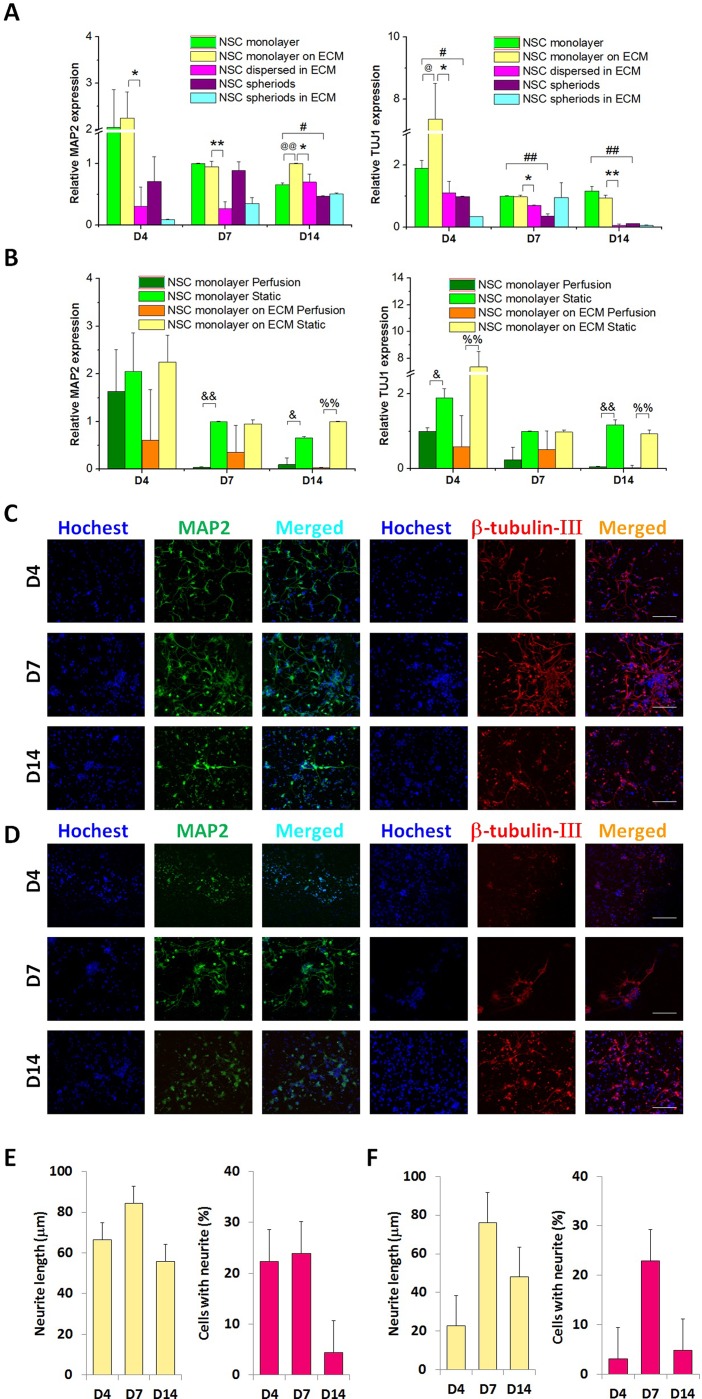
FIG. 5.
Capability of NSCs to differentiate into neurons at 4, 7, and 14 days. (A) Quantitative analysis of MAP2 and TUJ1 mRNA expression in the five culture groups under the static condition, n = 3. (B) Quantitative analysis of MAP2 and TUJ1 mRNA expression in the NSC monolayer and NSC monolayer on the ECM in perfusion and static culture, respectively, n = 3. (C) Confocal images of the NSC monolayer in static culture. Green represents MAP2, red is β-tubulin-III, and blue is the nucleus. (D) Confocal images of the NSC monolayer on the ECM in static culture. Green represents MAP2, red is β-tubulin-III, and blue is the nucleus. Scale bars represent 100 μm. (E) Neurite length (n = 50) and the percentage of cells with neurites (n = 10) in the NSC monolayer under static conditions. (F) Neurite length (n = 50) and the percentage of cells with neurites (n = 10) in the NSC monolayer on the ECM under static conditions.

