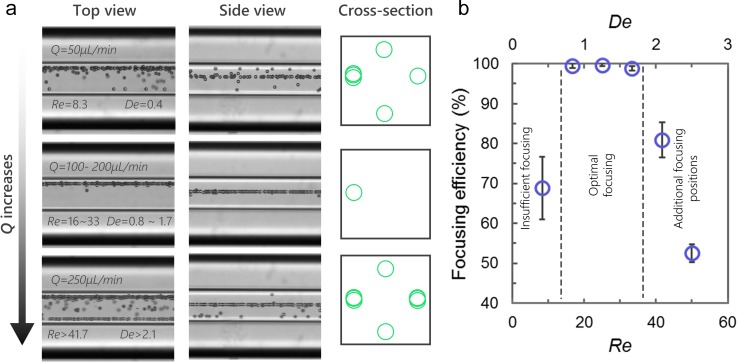
FIG. 3.
Optimizing flow rate for 3D focusing. (a) Stacked bright-field images (n = 100) from top view and side view show focusing of 10 μm microbeads near the outlet at flow rate of 50 μl/min–250 μl/min. The schematics illustrate the focusing pattern from cross-section view. (b) Quantitative analysis (n = 5) of focusing efficiency at corresponding Re and De.

