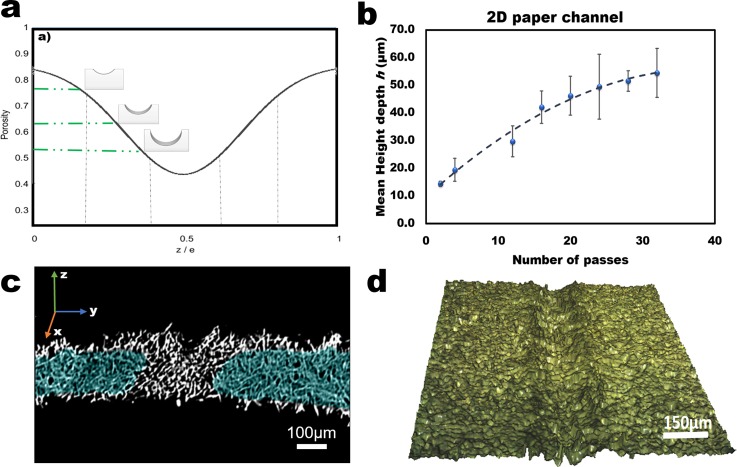
FIG. 2.
Summary of results: (a) Expected results from TACH microfluidic channels based on the porosity versus thickness ratio. (b) Quantitative curve of the mean depth profile vs number of passes after calendaring paper by TACH. (c) Capillary movement of water collected by x-ray image of a cross-section of a shallow channel on Whatman no. 1 chromatography paper. (d) Tomography imaging of a deep channel prepared by TACH.

