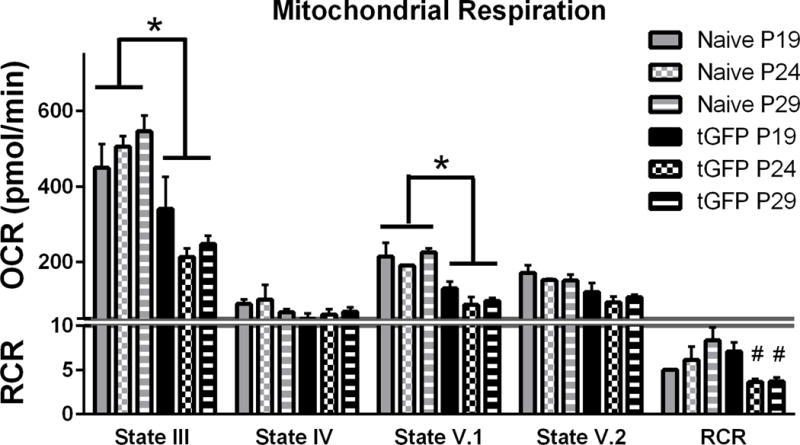
Figure 4.

Oxygen Consumption Rates (OCR) of isolated tGFP-labeled mitochondria or naïve non-labeled mitochondria at different passage generations. One way ANOVA was performed for each state of respiration within treatment groups. With no significant differences among passage number OCR values using a one way ANOVA, the groups were collapsed (indicated by the horizontal bars) and compared using Student’s T tests to determine overall group effects. RCR were analyzed using a one way ANOVA for each cell group, with Tukey’s multiple comparisons. Bars are means ± SEM. *p<0.0001 tGFP vs Naïve; #p<0.05 vs tGFP P19. n= 3/group performed in triplicate.
