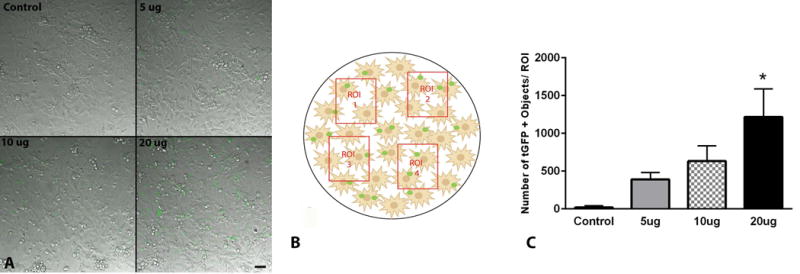
Figure 8.

tGFP mitochondria are taken up by PC-12 Adh cells in a dose-dependent manner. A. Representative DIC/FITC images of individual regions of interest (ROI) in cell cultures from each dosage showing varying amounts of tGFP mitochondria within cells. B. Schematic depiction of four random non-overlapping ROIs chosen per plate analyzed for each dosage, replicated in three plates. C. Quantification of ROI densities of tGFP for each dosage administered showed that the 20μg transplant group had the highest number of mitochondria taken up. Bars are means ± SEM. *p <0.05 vs control group using one-way ANOVA with Tukey’s multiple comparisons. n=3/dosage performed in triplicate, scale bar = 50μM, applies to all images.
