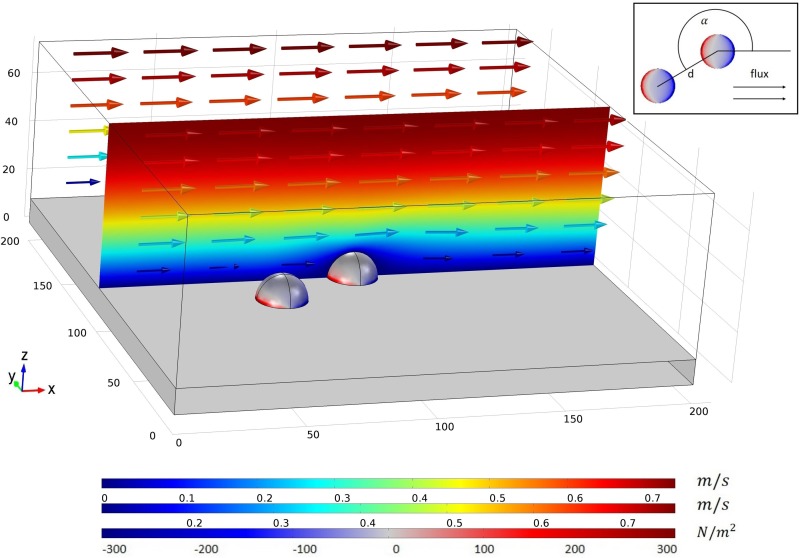
FIG. 1.
Image of the setup of a three-dimensional simulation: elastic cells are attached to the substrate and subjected to laminar flow. The flux direction and the velocity magnitude are indicated by coloured arrows. For a better resolution, the velocity magnitude is depicted in the x-z-cross-sectional plane using the same scale and colour range as the latter. The stress component with respect to the z-direction on both the cells and the substrate can be directly obtained from the simulations. The red and the blue colour represent the positive upward and negative downward stress within the cells, respectively. An aerial perspective of the setup is depicted in the top right corner showing the characteristic parameters and , where is the distance between two cell centres and is the angle between two neighboring cells with respect to the flow direction.

