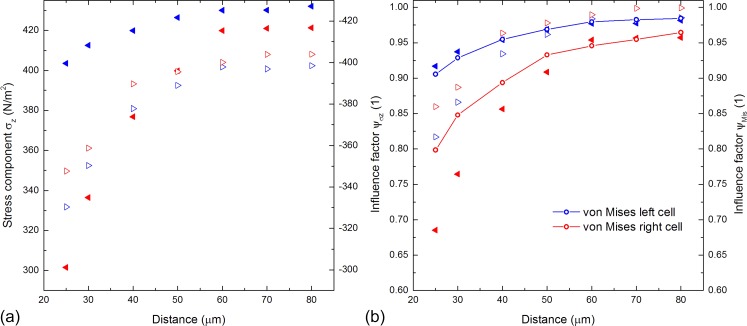
FIG. 3.
Vertical stress and influence factor for two aligned hemispherical cells. (a) The vertical stress component is plotted as a function of . We determined the stress at the front and the BP of both the cells indicated by blue and red triangles. The stress increases with increasing distance in all the cases. (b) The left vertical axis shows the values of the influence factor of the cell's AP and BP plotted versus the distance represented by triangles. The right vertical axis presents the calculated influence factor of the cell surfaces represented by lines and circles.

