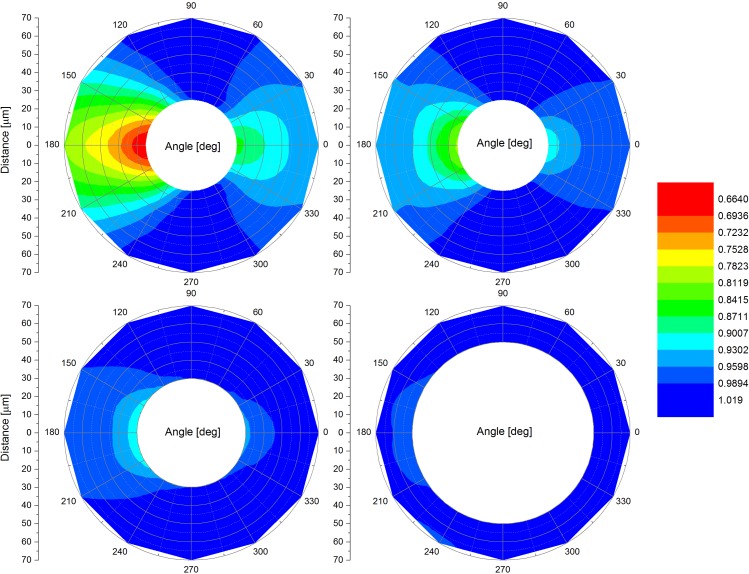
FIG. 5.
Influence factor of a stationary cell due to the presence of another cell as a function of the rotation angle and the cell distance. Each polar diagram represents a different cell shape (Fig. 7). Top left: sphere barely touching the substrate (h = 18 m). Top right: hemisphere (h = 10 m). Bottom left: high ellipsoid (h = 5 m). Bottom right: flat ellipsoid (h = 2.5 m). The influence on the stationary cell decreases with decreasing cell height.

