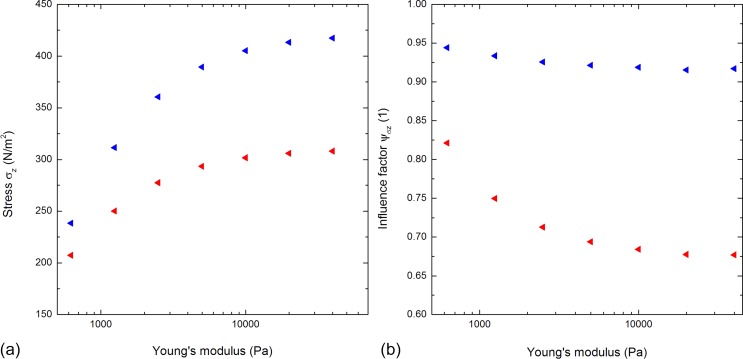
FIG. 6.
Both the figures are based on simulations of two aligned cells with respect to the flow direction at a constant distance . (a) The stress component in the z-direction is plotted versus the logarithmically scaled Young's modulus. The blue and red triangles represent the AP of the anterior and posterior cell, respectively. The stress increases with increasing Young's modulus. (b) The influence factor is plotted against the logarithmically scaled Young's modulus. The influence on the posterior cell is higher.

