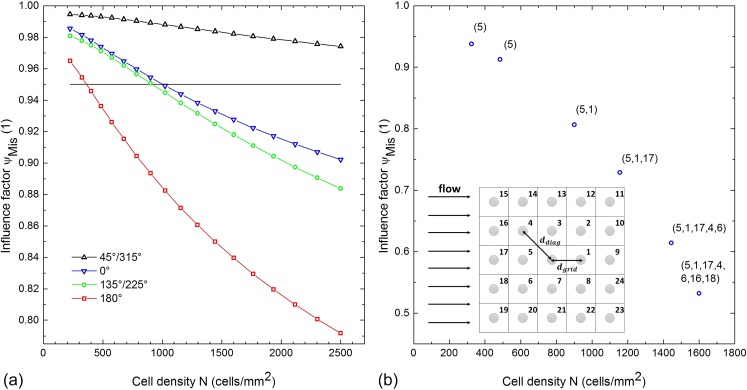
FIG. 9.
(a) Influence factor is plotted as a function of the cell density for various angles . The influence on cells due to their neighborhood increases with increasing cell density. In this example, 2500 cells/mm2 represents a “confluent” monolayer while the cell shape remained constant. (b) Influence factor of an arbitrary cell within an evenly distributed monolayer is plotted as a function of the cell density. The neighboring cells are labelled with a number as depicted in the inset. The numbers in parentheses next to the values indicate the influencing neighbors which contribute to the influence factor of the arbitrary cell determined by the neighborhood rule. Both the quantity and the influence on the arbitrary cell increase with increasing cell density.

