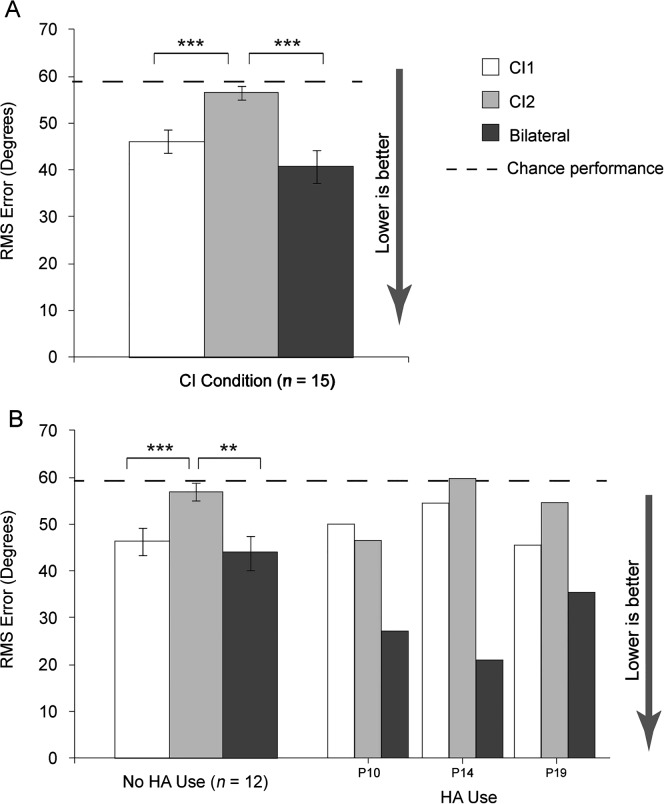
Figure 5.
Panel A shows group mean localization results for RMS error in degrees at the latest test interval for CI1, CI2, and the bilateral condition. Panel B shows group mean localization RMS error in degrees at the latest test interval for participants with no HA use and three individual participants with HA use. Scores are displayed as white bars for CI1, gray bars for CI2, and black bars for bilateral CIs. Chance performance is indicated by the dashed line at 59°. Error bars represent 1 SE. Asterisk(s) indicate significant differences: **p < .01; ***p < .001.

