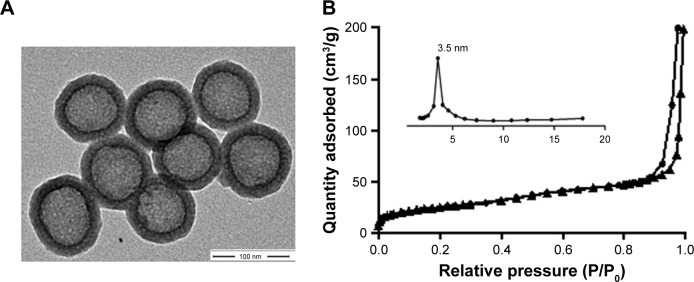
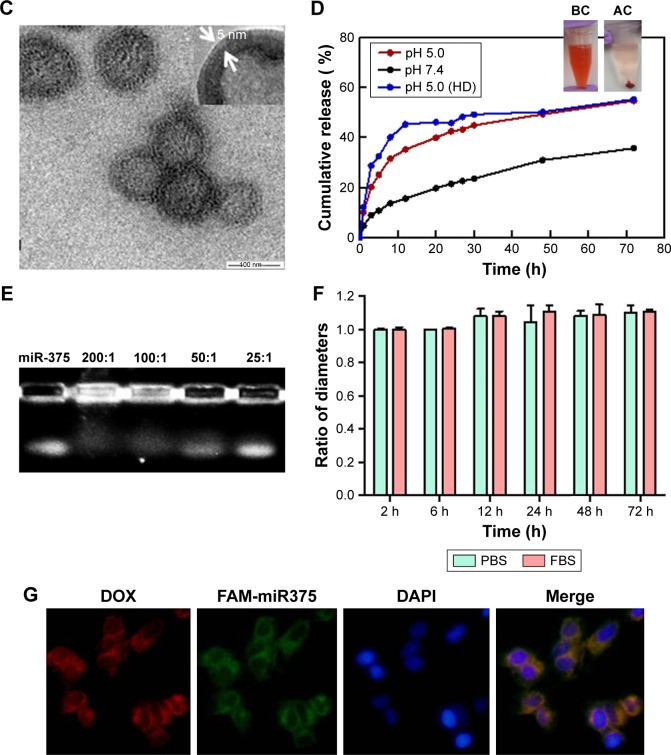
Figure 2.
Characterization of LHD/miR-375.
Notes: (A) TEM images of HMSN. (B) Nitrogen sorption isotherms and corresponding pore size distributions of HMSN samples. (C) TEM images of LHD. (D) Release of DOX from the LHD (at pH 5.0 and 7.4) and HD (at pH 5.0). Pictures of LHD solution before (BC) and after (AC) centrifugation were illustrated. (E) Detection of miR-375 loading efficiency by agarose gel electrophoresis at LHD/miR-375 ratios from 25:1 to 200:1 (w/w). (F) Time-dependent stability of LHD in PBS and FBS at 37°C. (G) Cellular uptake of LHD/miR-375 and intracellular distribution of DOX and miR-375 in HepG2 cells after 1 h incubation.
Abbreviations: DAPI, 4′,6-diamidino-2-phenylindole; DOX, doxorubicin hydrochloride; FBS, fetal bovine serum; HD, HMSN loaded with doxorubicin hydrochloride; HMSN, hollow mesoporous silica nanoparticles; LHD, lipid-coated hollow mesoporous silica nanoparticles containing doxorubicin hydrochloride; PBS, phosphate-buffered saline; TEM, transmission electron microscope.


