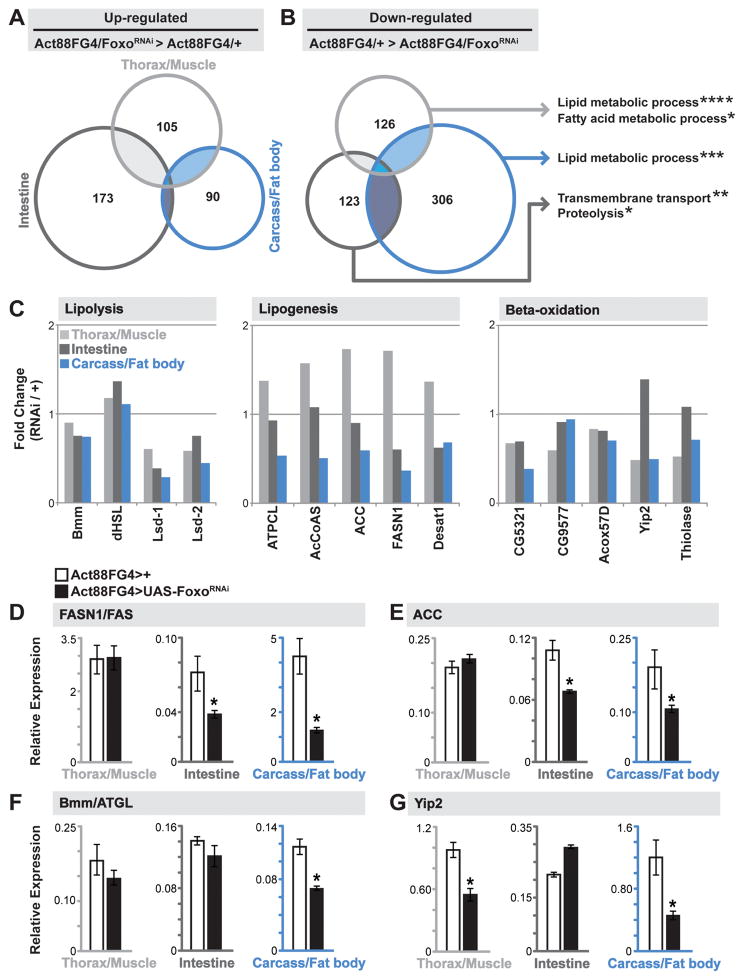
Figure 2. Divergent Tissue-specific Transcriptome Responses to Foxo Depletion in Muscle.
(A–B) Venn Diagrams showing autonomously (dissected thorax/muscle) and systemically (dissected carcass/fat body and intestine) up-regulated and down-regulated genes upon mu-specific depletion of Foxo (compared to Act88FGal4>+(w1118) controls). Up- and down-regulated genes were analyzed for Gene Ontology (GO) terms (FlyMine). The threshold for genes included in the analysis was; (i) changes in RPKM values of least 2 fold up- or down-regulated in thorax/muscle and intestine, 2.5 fold in carcass/fat body, compared to controls, and (ii) a minimum RPKM value of 5. Significantly represented GO terms for down-regulated genes for unique tissue transcriptomes (far right). *p-value<0.05; **p-value<0.01; ***p-value<0.001; ****p-value<0.00001.
(C) Fold change (in transcriptome RPKM values, Act88FGal4>FoxoRNAi/Act88FGal4>+ ctrl.) of select genes/enzymes involved in lipolysis (left), lipid synthesis (middle), and lipid oxidation (right) in unique tissues.
(D–G) Drosophila FASN1, ACC, bmm, and yip2 transcription (measured by qRT-PCR) in unique tissues upon mu-specific depletion of Foxo. Bars represent mean±SE, n=6 samples, *p-value<0.01.
See also Figures S2, S3, S4, and Table S1.

