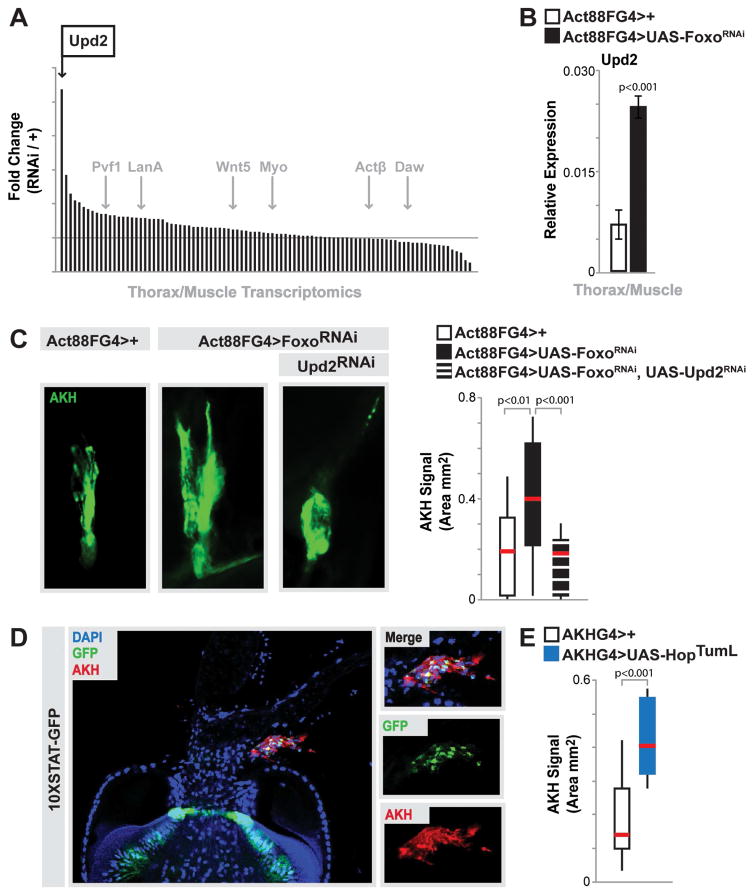
Figure 5. Muscle-derived Upd2 Governs AKH Levels.
(A) Histogram plotting fold change (in thorax/muscle transcriptome RPKM values, Act88FGal4>FoxoRNAi/Act88FGal4>+ ctrl.) of genes representing known/putative secreted factors. Upd2 (black arrow) and other known secreted factors (gray arrows) highlighted.
(B) upd2 transcription (measured by qRT-PCR) in dissected thorax/muscle upon mu-specific depletion of Foxo. n=6 samples. Bars represent mean±SE.
(C) Representative images of CC AKH immunostain (anti-AKH, green) upon mu-specific depletion of Foxo and Upd2 (RNAi line HMS00901). Quantification of immunostain signal area (mm2), represented as box plot (median, red line). n=12–16 samples.
(D) Proventriculus and CC cells expressing the 10XSTAT-GFP reporter. STAT-GFP (green) expression largely overlaps with AKH immunostain (red) in CC cells, DAPI (blue).
(E) Quantification of CC AKH immunostain signal area (mm2), represented as box plot (median, red line), upon over activation of Hop (HopTumL) in CC AKH-producing cells (using AKHGal4). n=12–16 samples.
Controls animals represent Act88FGal4>+(w1118) and AKHGal4>+(w1118).

