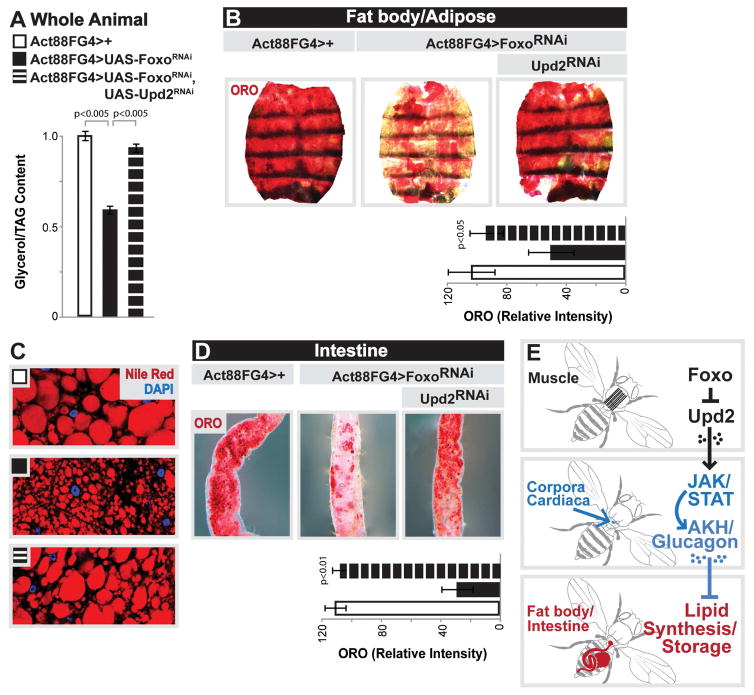
Figure 6. Muscle-derived Upd2 Mediates Muscle-dependent Effects on Systemic Lipid Homeostasis.
(A–D) Changes in systemic lipid metabolism upon mu-specific depletion of Foxo and Upd2
(A) Total TAG levels of whole flies. n=5 samples.
(B,D) ORO stain of dissected carcass/fat body and intestines. Intensity quantification of ORO, n=8–15 samples.
(C) Nile red stain (for LD) of dissected carcass/fat body; nile red (red) and DAPI (blue) detected by immunostaining.
(E) Proposed model depicting the communication axes between the muscle, CC/AKH producing cells, and fat storages tissues.
Bars represent mean±SE. All controls animals represent Act88FGal4>+(w1118).
See also Figures S5 and S6.

