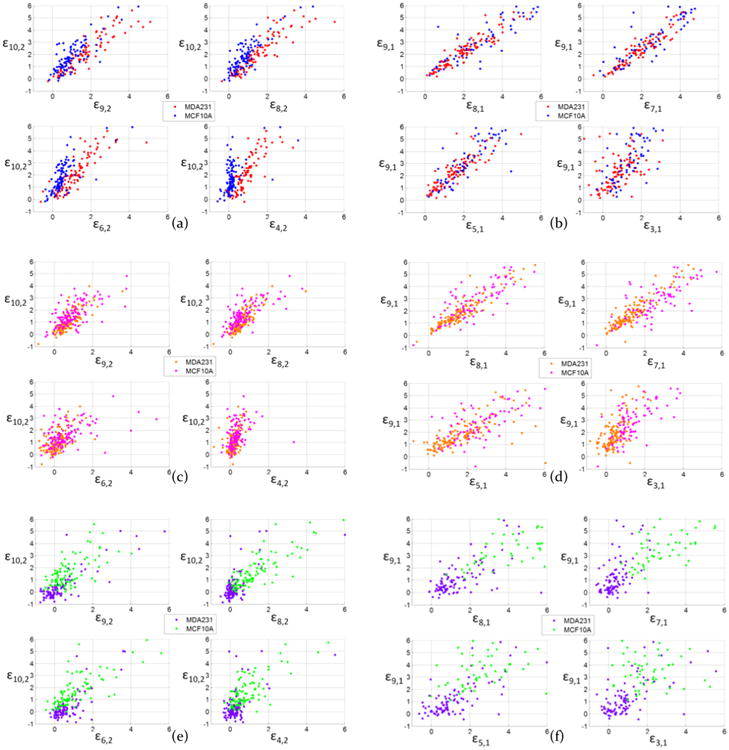
Figure 4.

Scatter plot of MDA-MB-231 cells and MCF-10A cells velocity increments of comparing ε10,2 to ε9,2, ε8,2, ε6,2, and ε4,2 in channel 1 (a), channel 2 (c), and channel 3 (e); and comparing ε9,1 to ε8,1, ε7,1, ε5,1, and ε3,1 in channel 1 (b), channel 2 (d), and channel 3 (f).
