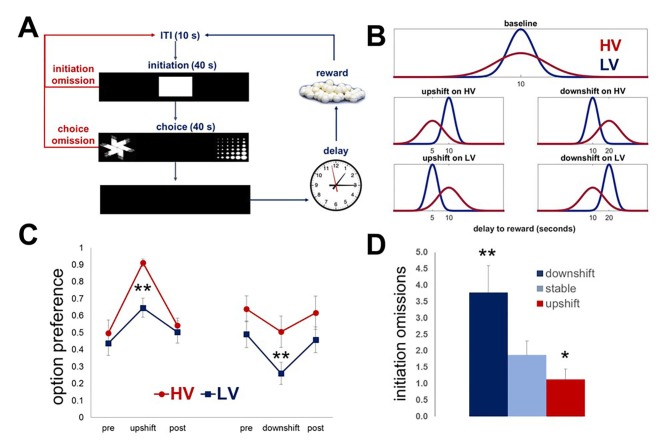
Figure 1. Task design and performance of intact animals.
Our task is designed to investigate the effects of expected outcome uncertainty on value learning. (A) Each trial began with stimulus presentation in the central compartment of the touchscreen. Rats (n = 8) were given 40 s to initiate a trial. If 40 s passed without a response, the trial was scored as an ‘initiation omission.’ Following a nosepoke to the central compartment, the central stimulus disappeared and two choice stimuli were presented concurrently in each of the side compartments of the touchscreen allowing an animal a free choice between two reward options. An animal was given 40 s to make a choice; failure to select an option within this time interval resulted in the trial being scored as ‘choice omission’ and beginning of an ITI. Each response option was associated with the delivery of one sugar pellet after a delay interval. (B) The delays associated with each option were pooled from distributions that are identical in mean value, but different in variability: LV (low variability, shown in blue) vs. HV (high variability, shown in red); ~N(µ, σ): μ = 10 s, σHV=4s, σLV=1s. Following the establishment of stable performance, rats experienced value upshifts (µ = 5 s; σ kept constant) and downshifts (μ = 20 s) on each option independently, followed by return to baseline conditions. Each shift and return to baseline phase lasted for five 60-trial sessions. (C) Regardless of the shift type, animals significantly changed their preference in response to all shifts (all p values<0.05). However, significant differences between HV and LV in choice adaptations were observed for both upshifts and downshifts: greater variance of outcome distribution at baseline facilitated behavioral adaptation in response to value upshifts (HV vs LV difference, p=0.004), but rendered animals suboptimal during downshifts (p=0.027); conversely, low expected uncertainty at baseline led to decreased reward procurement during upshifts in reward. The data are shown as group means for option preference during pre-baseline, shift and post-baseline conditions, ± SEM. The asterisks signify statistical differences between HV and LV conditions. (D) The number of initiation omissions was significantly increased during downshift (p=0.004) and decreased during upshifts (p=0.017) in value, regardless of the levels of expected uncertainty, demonstrating effects of overall environmental reward conditions on motivation to engage in the task. The data are shown as group means by condition +SEM. *p<0.05, **p<0.01. Summary statistics and individual animal data are provided in Figure 1—source data 1.
DOI: http://dx.doi.org/10.7554/eLife.27483.003

