. 2017 Jul 6;6:e27483. doi: 10.7554/eLife.27483

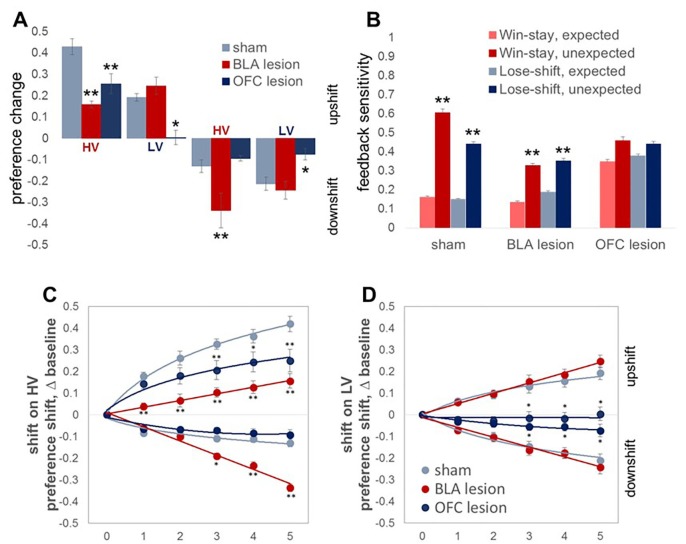
Figure 4. Changes in choice preference in response to value shifts and learning strategies in experimental groups.

(A) The OFC-lesioned rats (n = 8) were less optimal on our task: they changed their option preference to a significantly lesser degree compared to control animals (n = 8) during upshifts on HV (p=0.005) and LV (p=0.039), as well as the downshift on LV option (p=0.015). Conversely, animals with BLA lesions (n = 8) changed their option preference to a lesser degree on HV upshifts (p<0.0001), but compensated by exaggerated adaptations to HV downshifts (p<0.0001). Group means for option preference during pre-baseline, shift and post-baseline conditions are shown in Figure 4—figure supplement 1. We broke the trials into two types: when the delays fell within distributions experienced for each option at baseline (expected outcomes) and those in which the degree of surprise exceeded that expected by chance (unexpected outcomes). Win-stay/lose-shift scores were computed based on trial-by-trial data: a score of 1 was assigned when animals repeated the choice following better than average outcomes (win-stay) or switched to the other alternative following worse than average outcomes (lose-shift). Sham-lesioned animals demonstrated increased sensitivity to unexpected feedback (p values < 0.001). Similarly, the ability to distinguish between expected and unexpected outcomes was intact in BLA-lesioned animals (p values < 0.001), although their sensitivity to feedback decreased overall. In contrast, OFC-lesioned animals failed to distinguish expected from unexpected fluctuations. (C,D) To examine the learning trajectory we analyzed the evolution of option preference. BLA-lesioned animals were indistinguishable from controls during the shifts on LV option. Whereas, this experimental group demonstrated significantly attenuated learning during the upshift on HV (p values < 0.0001 for all sessions) and potentiated performance during sessions 3 through 5 on HV downshift (p values < 0.05) compared to sham group. Conversely, learning in OFC-lesioned animals was affected on the majority of the shift types: these animals demonstrated significantly slower learning during sessions 3 through 5 during upshift on HV (p values < 0.05), all sessions during upshift on LV (p values < 0.05) and sessions 3 through 5 during downshift on LV (p values < 0.05). Session 0 refers to baseline/pre-shift option preference. Despite these differences in responses to shifts in value under conditions of uncertainty, we did not observe any deficits in basic reward learning in either the BLA- or OFC-lesioned animals, shown in Figure 4—figure supplement 2. The data are shown as group means by condition +SEM. *p<0.05, **p<0.01. Summary statistics and individual animal data are provided in Figure 4—source data 1 and Figure 4—source data 2.

DOI: http://dx.doi.org/10.7554/eLife.27483.010

Figure 4—source data 1. Summary statistics and individual data for changes in choice preference and learning strategies.
DOI: 10.7554/eLife.27483.011
Figure 4—source data 2. Summary statistics and individual data demonstrating experimental group differences in response to shifts.
DOI: 10.7554/eLife.27483.012

Figure 4.

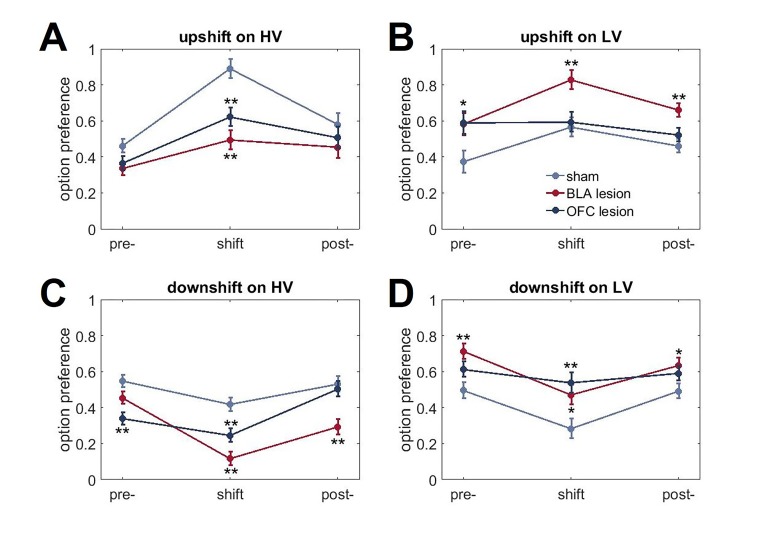
Figure 4—figure supplement 1. Changes in choice behavior in response to value shifts.

Figure 4—figure supplement 1.

(A) Both lesion groups demonstrated reduced adaptations to value upshifts on HV option (p<0.01). (B). BLA-lesioned animals chose LV option more frequently than controls when its value was increased (p<0.01). (C, D) Both BLA- and OFC-lesioned animals also showed reduced HV option preference (p<0.01) and increased LV option preference (p<0.05) during downshifts compared to sham animals. This pattern of results can be explained by changes in choice behavior even under baseline conditions in BLA- and OFC-lesioned animals that interacted with rats’ ability to learn about shifts in value. Indeed, there were significant group differences in pre-shift baseline preferences. The data are shown as group means for option preference during pre-baseline, shift and post-baseline conditions, ± SEM. *p<0.05, **p<0.01. Summary statistics and individual animal data are provided in Figure 4—source data 2.
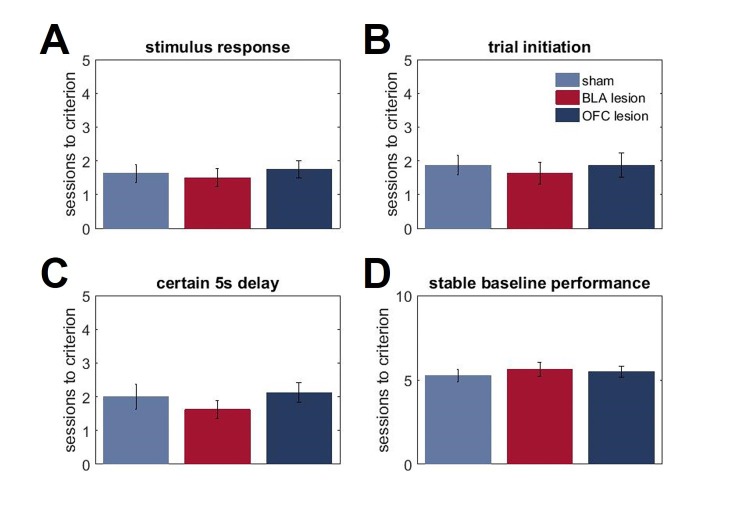
Figure 4—figure supplement 2. The lack of group differences in basic reward learning.

Figure 4—figure supplement 2.

Our surgeries took place prior to any exposure to the testing apparatus or behavioral training. Both lesioned groups were indistinguishable from controls at early stages of the task. During pre-training, animals first learned to respond to visual stimuli presented in the central compartment of the screen within 40 s time interval in order to receive the sugar reward (stimulus response). Next, rats learned to initiate the trial by nosepoking the bright white square stimulus presented in the central compartment of the touchscreen; this response was followed by disappearance of the central stimulus and presentation of a target image in one side compartment of the touchscreen (trial initiation). Responses to the target image produced an immediate reward. The last stage of training was administered to familiarize animals with delayed outcomes. The protocol was identical to the previous stage, except the nosepoke to the target image and reward delivery were separated by a 5 s stable delay (certain 5 s delay). (A, B). Animals in all groups took similar number of days to learn to nosepoke visual stimuli on the touchscreen to receive sugar rewards (p=0.796) and to initiate a trial (p=0.821). (C, D). There were no group differences in responses to the introduction of a 5 s delay interval during pre-training (p=0.518) or the number of sessions to reach stable performance during the initial baseline phase of our uncertainty task (p=0.772). The data are shown as group means ± SEM.