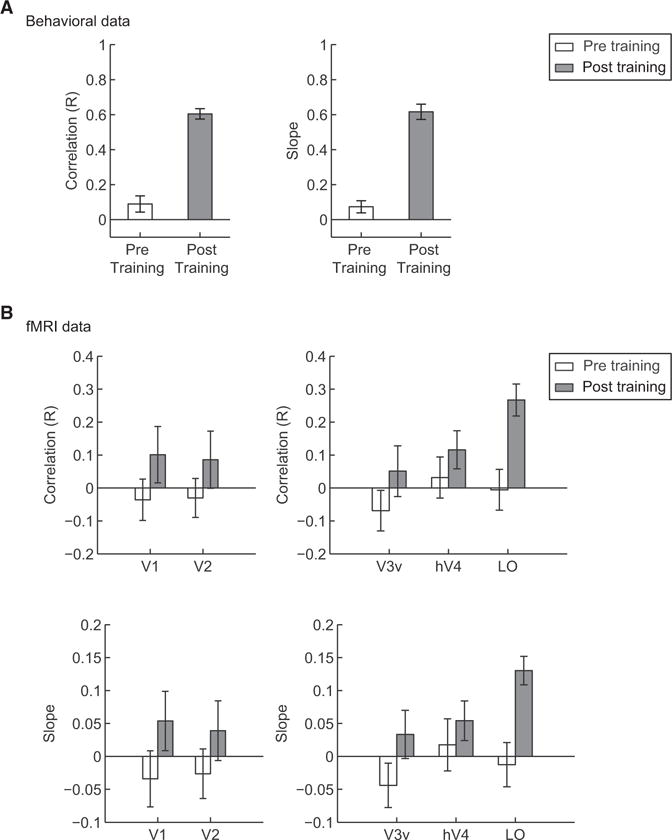
Figure 3.

Comparison of Behavioral, fMRI, and Ideal Class Distances
(A and B) Correlations of behavioral (A) and fMRI (B) class distances with the ideal class distance for each of the 21 informative image parts. fMRI signals were derived from training the SVM classifier on the basis of the choices of the human observers (Figures 3 and S2B) or the ideal observer (Figure S2A) with the classifier’s performance. Correlations were performed for each participant before and after training. Mean R coefficient and slope values across participants are plotted. Error bars indicate the SEM. Because of noisy BOLD signals, these values are lower for fMRI than behavioral data.
