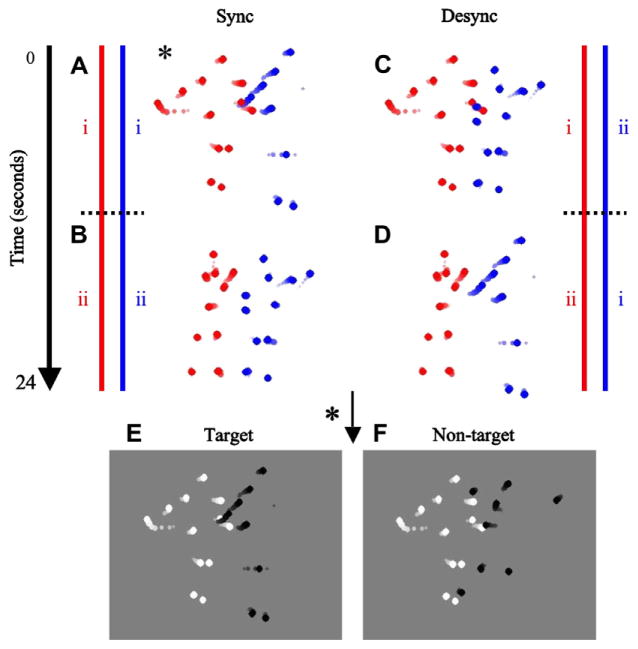
Fig. 2.
Stimulus and psychophysical procedure. (A–D) Red and blue lines depict the database consisting of a 24 s sequence of tracked trajectories of a dancing routine between two agents obtained through motion capture. Static depictions representing movie segments are represented by dot streaks in which the contrast and size of the individual dots increase with time. The sequence is divided into two halves, i and ii, as depicted by the dotted black lines. Sync trials consist of a short segment randomly selected from the two synchronized sequences (A) i–i and (B) ii–ii. Desync trials consist of a short segment randomly selected from the two desynchronized sequences obtained by cross-pairing i and ii for the two agents, (C) i–ii and (D) ii–i. Each trial could be of either Sync or Desync type, and were randomly presented within a block. Each trial consisted of two intervals. The Sync trial depicted with the * marker in (A) was chosen to illustrate these two intervals (E and F). (E) The target interval showed a randomly selected 3 s segment with the dot trajectories of one agent randomly selected to be dark while the dot trajectories of the second agent were bright on a gray background. (F) The non-target interval showed another segment, but with one of the agents randomly selected to have its 13 dot trajectories scrambled so that the structure of the agent was destroyed while the local motion information of the individual dots was preserved. The observers’ task was to determine the target interval. Static depictions representing the moving stimuli are represented by dot streaks in which the contrast and size of the individual dots increase with time (these manipulations were not present in the actual stimuli). In order to vary the strength of biological motion, we randomly varied the number of dot trajectories selected to be displayed in each trial (6, 11, 16, 21, or 26, out of a total of 26 dot trajectories). The stimulus level represented in this figure has 26 dot trajectories. (For interpretation of the references to color in this figure legend, the reader is referred to the web version of this article.)

