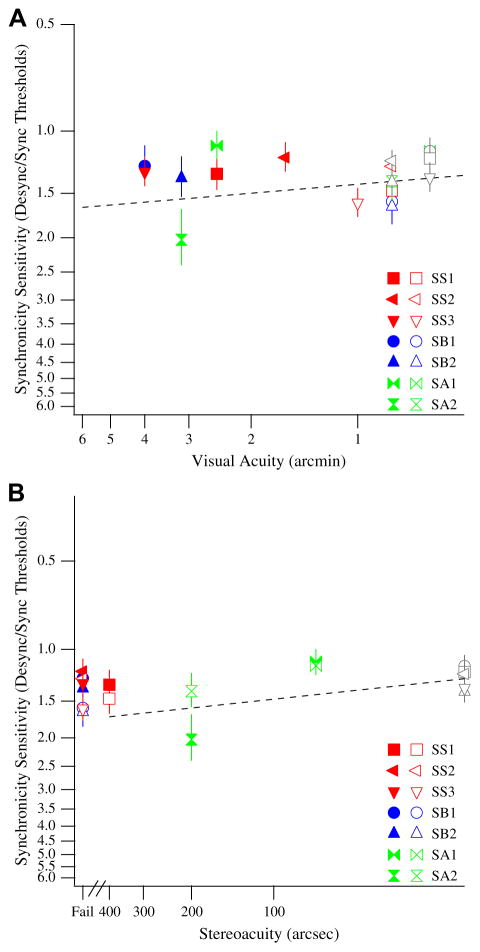
Fig. 5.
(A) Visual acuity versus synchronicity sensitivity. The synchronicity sensitivities for the amblyopic eye (solid colored symbols) and the non-amblyopic eye (open colored symbols) of strabismic (red), strabismic and anisometropic (blue), and non-strabismic anisometropic (green) observers are plotted against their visual acuities. The synchronicity sensitivities for control (open gray symbols) observers are also plotted against their visual acuities. Different symbols refer to different observers. Smaller synchronicity sensitivities and smaller visual acuities correspond to better sensitivity (axes have been reversed to represent this). The regression line for control, amblyopic, and non-amblyopic data is plotted. (B) Stereoacuity versus synchronicity sensitivity. The synchronicity sensitivities for the amblyopic eye (solid colored symbols) and the non-amblyopic eye (open colored symbols) of strabismic (red), strabismic and anisometropic (blue), and non-strabismic anisometropic (green) observers are plotted against their stereoacuities. The synchronicity sensitivities for control observers (open gray symbols) are also plotted against their stereoacuities. Observers who did not pass the stereoacuity test are denoted as ‘Fail’ on the abscissa. Different symbols refer to different observers. Smaller synchronicity sensitivities and smaller stereoacuities correspond to better sensitivity (axes have been reversed to represent this). The regression line for control, amblyopic, and non-amblyopic data is plotted (regression line does not include data from observers who failed the stereoacuity test). (For interpretation of the references to color in this figure legend, the reader is referred to the web version of this article.)

