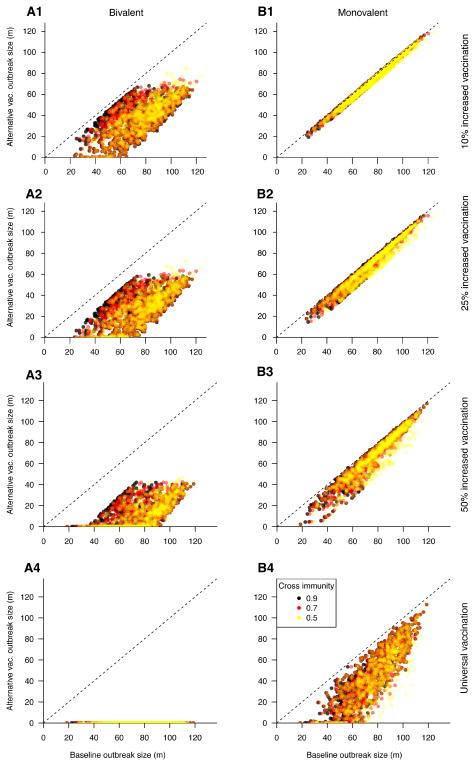
Figure 1.
Change in cumulative incidence resulting from increased vaccination coverage strategies, relative to baseline coverage of the monovalent vaccine. Each panel represents a vaccination scenario; bivalent (left) and monovalent (right) vaccination at increasing coverage levels (top to bottom) are compared to the baseline coverage of monovalent vaccine. Points denote individual simulations; points below the diagonal represent simulations in which the alternative vaccination strategy reduced the size of the outbreak relative to the baseline scenario.

