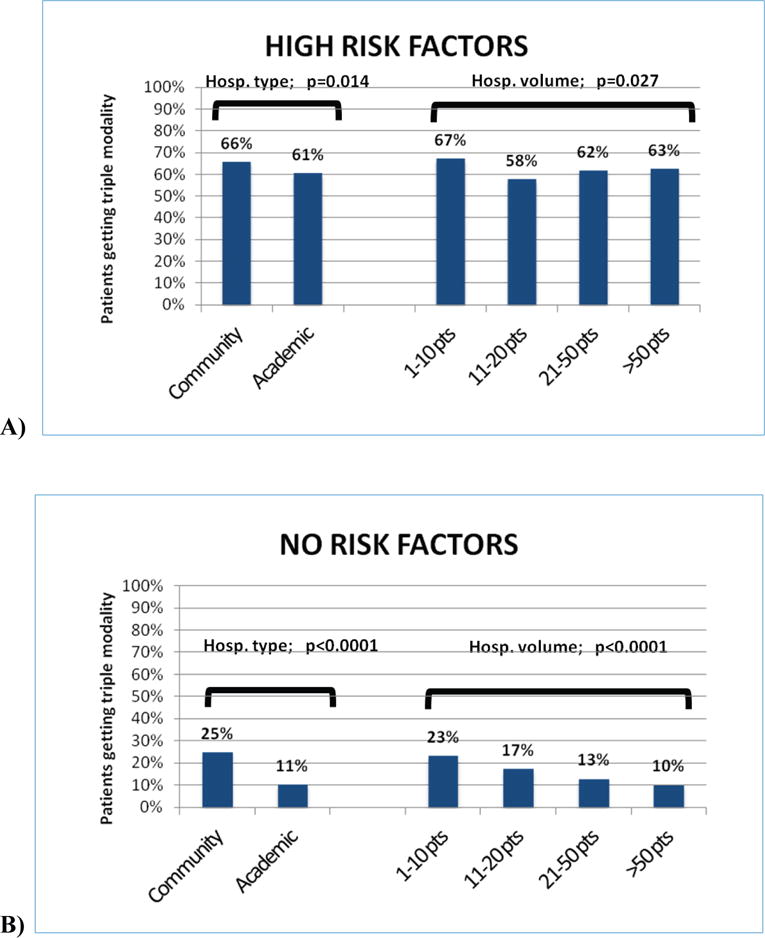
Figure 3.

Hospitals’ provision of postoperative CRT based on pathologic risk factor groups. A) High Risk Factors Group; on the left, provision of postoperative CRT according to hospital type; on the right, provision according to hospital volume B) No Risk Factors Group; on the left, provision of postoperative CRT according to hospital type; on the right, provision according to hospital volume. P-values represent chi-square statistics.
