
Figure 6.
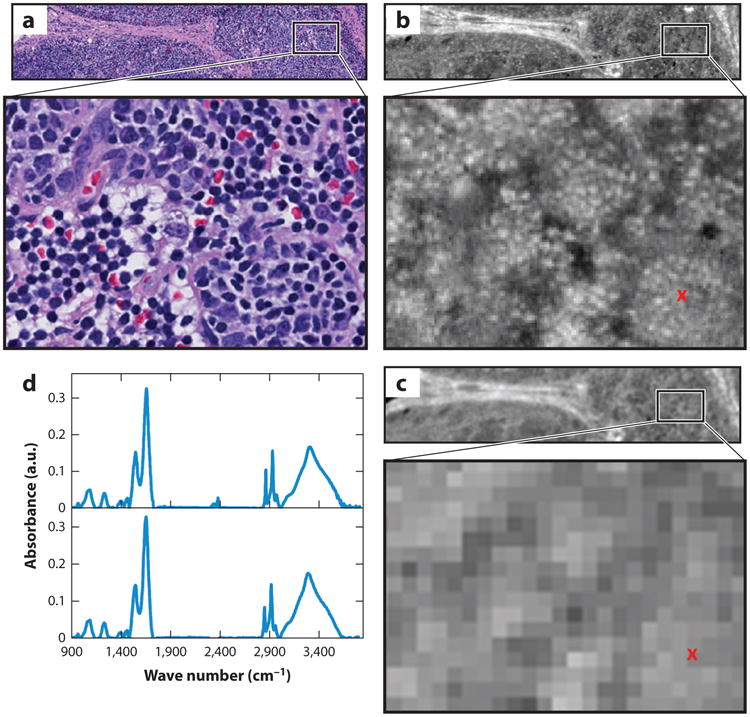
Comparison of hematoxylin and eosin (H&E)-stained optical microscopy and infrared (IR) images of lymph node tissue. (a) An H&E-stained image from a healthy submandibular lymph node biopsy. (b) A high-definition IR image of a serial section of the lymphoid tissue. (c) The same region imaged with a lower-resolution Fourier transform IR (FT-IR) imaging spectrometer. The IR images show the absorbance at 3,075 cm−1 after baseline correction. (d) Sample spectra plotted from the pixel marked with a red x in panel c. There is a slight discordance between the H&E and IR images because they are on different tissue sections.