Figure 2.

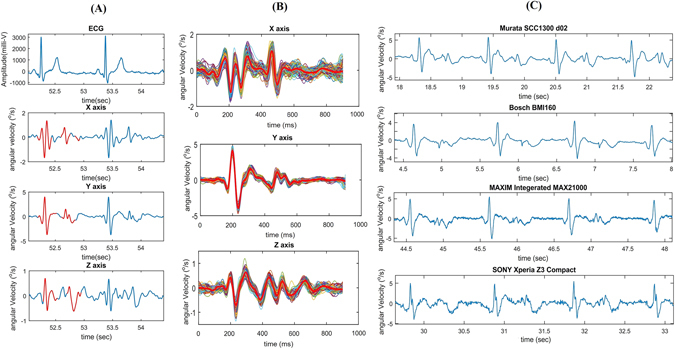
Typical three dimensional GCG waveforms from x, y, and z axes of rotation. 3-axis GCG morphologies and reference ECG (A). 3-axis ensemble averaged GCG morphologies (B). GCG y-axis waveforms obtained using different sensors (C).

Typical three dimensional GCG waveforms from x, y, and z axes of rotation. 3-axis GCG morphologies and reference ECG (A). 3-axis ensemble averaged GCG morphologies (B). GCG y-axis waveforms obtained using different sensors (C).