Figure 2.

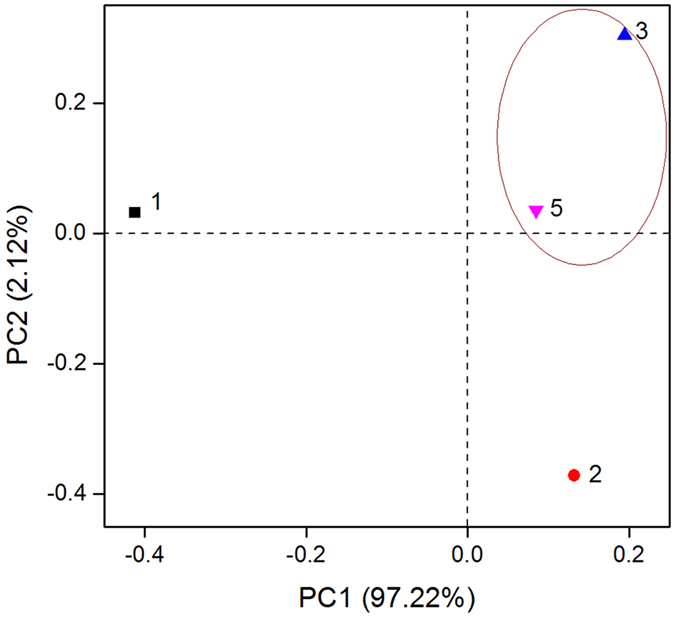
PCA analysis of DNRA communities in the Yellow River Estuary. The circle indicates that the communities in the two sites share higher similarities. Percentages represent the amount variance explained by each dimension.

PCA analysis of DNRA communities in the Yellow River Estuary. The circle indicates that the communities in the two sites share higher similarities. Percentages represent the amount variance explained by each dimension.