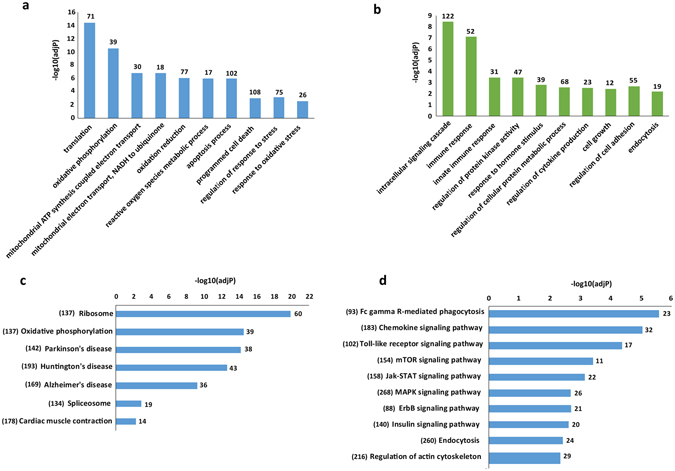
Figure 2.

The GO and KEGG pathway analysis of DE protein-coding genes in primary monocytes of XLA patients compared to healthy subjects. The significant GO biological process terms (adj.P-value < 0.01) enriched for (a) upregulated genes, and (b) downregulated genes. The number of identified DE protein-coding genes enriched in each GO terms is depicted above bars of x-axis in the figure. The significant KEGG pathway terms enriched for (c) upregulated genes and (d) downregulated genes. Each statistical significance value (adj.p-value) was negative log-10 base transformed.The numbers in the brackets indicated the total number of genes available in the KEGG database for each pathway terms. The number of identified DE protein-coding genes enriched in each KEGG pathways is depicted above bars of x-axis in the figure.
