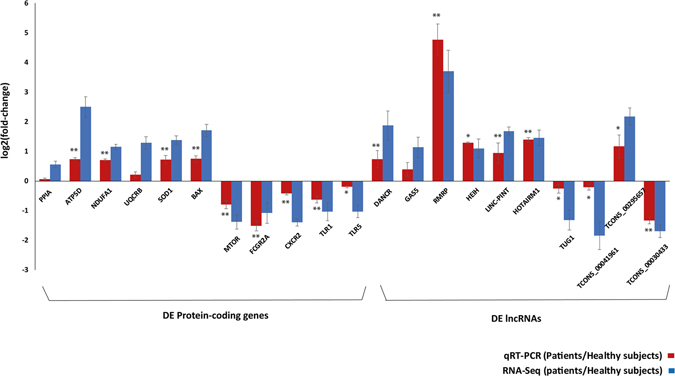
Figure 6.

The qRT-PCR validation of DE protein-coding genes and DE lncRNAs in primary monocytes of XLA patients compared to the healthy subjects. The comparison of log2 fold-change of DE protein-coding genes and DE lncRNAs were determined by RNA-Seq analysis (blue) and qRT-PCR validation (red). PPIA was used as endogenous control for normalizing the expression levels. x-axis shows genes; y-axis shows the log2 ratio of expression in XLA patients compared to healthy subjects. Statistical significance was calculated using paired Student’s T-test. The asterisks above the bars denote statistically significant differences from healthy subjects obtained by qRT-PCR, *P-value < 0.05, **P-value < 0.01.
