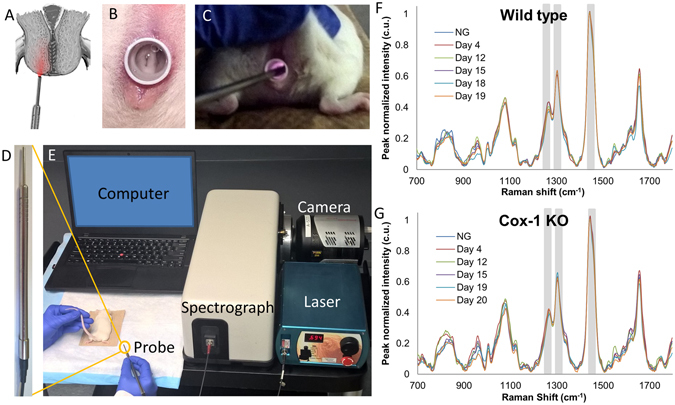
Figure 2.

In vivo Raman spectroscopy system for cervical assessment during pregnancy. (A) Illustration showing the placement of the Raman spectroscopy fiber optic probe against the ectocervix of the mouse. (B) Mouse cervix visualized using a speculum. (C) In vivo Raman spectroscopy during measurement of mouse cervix. (D) Raman spectroscopy fiber optic probe. (E) Image of in vivo Raman spectroscopy system. Average Raman spectra from different time points during pregnancy in WT (F) and Cox-1 KO (G) mice. Gray boxes indicate regions that were highlighted in Figs 3–4.
